No Boundary Really Between Genetic and Epigenetic
(Ho and Saunders, 1979) wrote: 'The intrinsic dynamical structure of the epigenetic system itself, in its interaction with the environment, is the source of non-random variations which direct evolutionary change, and that a proper study of evolution consists in the working out of the dynamics of the epigenetic system and its response to environmental stimuli as well as the mechanisms whereby novel developmental responses are canalized.'
Genes, like people, have families — lineages that stretch back through time, all the way to a founding member. That ancestor multiplied and spread, morphing a bit with each new iteration. Junk DNA can mutate into functioning genes. Epigenetics help turn genes on or off in gene-expression.
https://www.quantamagazine.org/20150818-a-surprise-source-of-lifes-code/
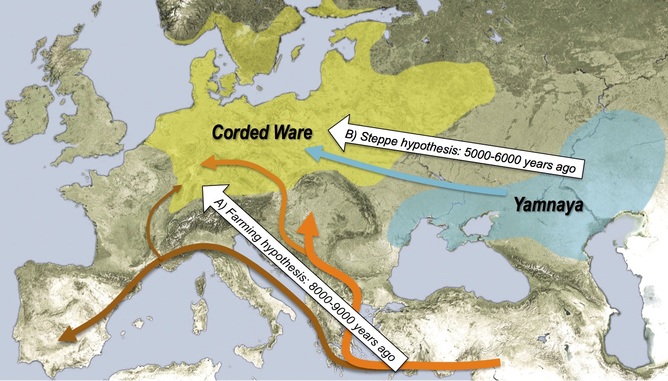
Most present-day Europeans derive from at least three highly differentiated populations: west European hunter-gatherers, who contributed ancestry to all Europeans but not to Near Easterners; ancient north Eurasians related to Upper Palaeolithic Siberians, who contributed to both Europeans and Near Easterners; and early European farmers, who were mainly of Near Eastern origin but also harboured west European hunter-gatherer related ancestry.
http://www.theguardian.com/commentisfree/2015/sep/11/homo-naledi-humans-not-alone-evolution?CMP=fb_gu
http://www.theguardian.com/commentisfree/2015/sep/11/homo-naledi-humans-not-alone-evolution?CMP=fb_gu
About 360 years, or just short of 15 generations. At 15 generations, an individual living today would carry only three thousands of 1% (00.003052%) of the DNA of an ancestor who was “pure” anything 15 generations ago. So even if one ancestor was indeed Mediterranean 15 generations ago, unless they continuously intermarried within a pure Mediterranean population, the amount would drop by 50% with each
generation to the miniscule amount that would be found in today’s current generation. With today’s technology, this is simply untraceable in autosomal DNA.
An autosomal DNA test only goes back 8 generations.
generation to the miniscule amount that would be found in today’s current generation. With today’s technology, this is simply untraceable in autosomal DNA.
An autosomal DNA test only goes back 8 generations.
What DNA Actually Looks Like
DNA, we are taught early on, is colorful. The building block of life is not just a whirligig-like twist, its purines and pyrimidines neatly paired and labeled; it is also an explosion of primary reds and blues and greens and yellows, the As and the Gs and the Cs and the Ts linked together to create a kind of modified, twisted rainbow.
Of course, that rendering takes artistic license. Watson and Crick determined DNA's structure [pdf, but a highly awesome one] based on a combination of sophisticated guesswork and, crucially, x-ray crystallography -- and that remains a workable, and powerful, technique for visualizing DNA strands. But crystallography creates its own kind of rendering: It's a technology whose imaging power relies on diffracted light. When we look at those now-iconic images of the double helix, the fuzzy X inside the fuzzy O, we're not seeing the DNA itself so much as we're seeing x-rays deflected from its atoms.
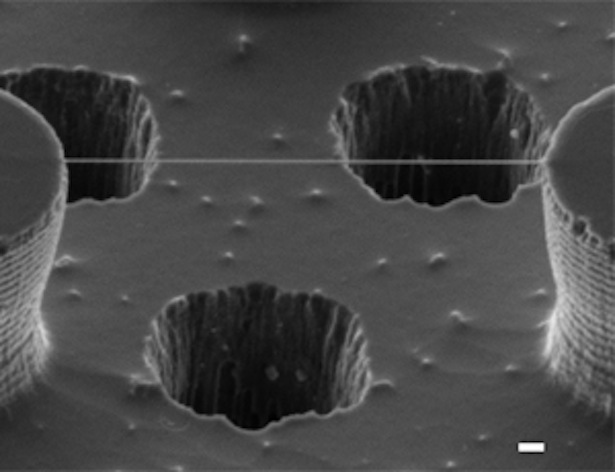
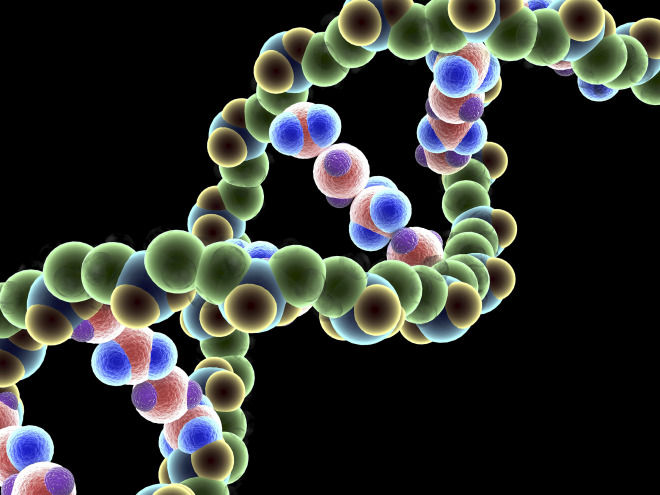
Which makes the image below pretty amazing. Though it is significantly less colorful than textbook DNA, and a tad less tidy than the double helix-demonstrating images produced by x-ray crystallography, it is, in certain ways, much more realistic. It isn't a rendering; it's a direct image of DNA, captured through an electron microscope. Yes. YES.
Computer renderings and actual images of a DNA molecule, as seen through an electron microscope (Enzo di Fabrizio via New Scientist) The image shows a single thread of double-stranded DNA suspended on a bed of nanoscopic silicon pillars. It was created by Enzo di Fabrizio and a team at Italy's University of Genoa, which developed a new technique ("an experimental breakthrough," they call it) for the purpose. The team, New Scientist reports, found a way to snag strands of DNA out of a dilute solution by, essentially, dehydrating them. They developed a pattern of extremely water-repellent, silicon nanopillars -- pillars that would cause moisture to evaporate quickly and leave behind strands of DNA as threads. And then, at the base of their "nanopillar bed," the team drilled tiny (very, very tiny) holes. And through those holes, they shone beams of electrons, which allowed them to capture relatively high-resolution images of the DNA thread.
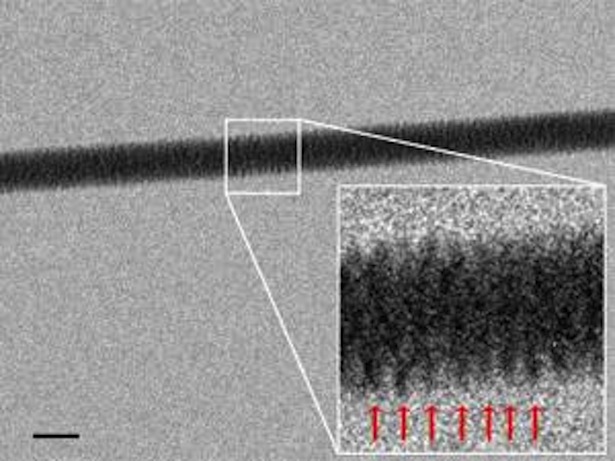
And here's an even-closer-up view of the strand itself, its base pairs fuzzily evident in the magnification.
The team just published the details of this imaging technique in the journal Nanoletters. And the new system represents a significant step forward for nanobiology and all the fields connected to it, giving scientists a new way to understand DNA. Particularly when it comes to its structure -- the stuff beyond the double helix. "Direct imaging becomes important," the paper notes, "when the knowledge at few/single molecule level is requested and where the diffraction does not allow to get structural and functional information." The technique, New Scientist points out, will help researchers to understand more precisely how proteins, RNA, and other biomolecules interact with DNA.
Which is exciting. But even for those of us who are not researchers, the new approach gives us a whole new way to do something else: to see where we came from.
DNA, we are taught early on, is colorful. The building block of life is not just a whirligig-like twist, its purines and pyrimidines neatly paired and labeled; it is also an explosion of primary reds and blues and greens and yellows, the As and the Gs and the Cs and the Ts linked together to create a kind of modified, twisted rainbow.
Of course, that rendering takes artistic license. Watson and Crick determined DNA's structure [pdf, but a highly awesome one] based on a combination of sophisticated guesswork and, crucially, x-ray crystallography -- and that remains a workable, and powerful, technique for visualizing DNA strands. But crystallography creates its own kind of rendering: It's a technology whose imaging power relies on diffracted light. When we look at those now-iconic images of the double helix, the fuzzy X inside the fuzzy O, we're not seeing the DNA itself so much as we're seeing x-rays deflected from its atoms.
Which makes the image below pretty amazing. Though it is significantly less colorful than textbook DNA, and a tad less tidy than the double helix-demonstrating images produced by x-ray crystallography, it is, in certain ways, much more realistic. It isn't a rendering; it's a direct image of DNA, captured through an electron microscope. Yes. YES.
Computer renderings and actual images of a DNA molecule, as seen through an electron microscope (Enzo di Fabrizio via New Scientist) The image shows a single thread of double-stranded DNA suspended on a bed of nanoscopic silicon pillars. It was created by Enzo di Fabrizio and a team at Italy's University of Genoa, which developed a new technique ("an experimental breakthrough," they call it) for the purpose. The team, New Scientist reports, found a way to snag strands of DNA out of a dilute solution by, essentially, dehydrating them. They developed a pattern of extremely water-repellent, silicon nanopillars -- pillars that would cause moisture to evaporate quickly and leave behind strands of DNA as threads. And then, at the base of their "nanopillar bed," the team drilled tiny (very, very tiny) holes. And through those holes, they shone beams of electrons, which allowed them to capture relatively high-resolution images of the DNA thread.
And here's an even-closer-up view of the strand itself, its base pairs fuzzily evident in the magnification.
The team just published the details of this imaging technique in the journal Nanoletters. And the new system represents a significant step forward for nanobiology and all the fields connected to it, giving scientists a new way to understand DNA. Particularly when it comes to its structure -- the stuff beyond the double helix. "Direct imaging becomes important," the paper notes, "when the knowledge at few/single molecule level is requested and where the diffraction does not allow to get structural and functional information." The technique, New Scientist points out, will help researchers to understand more precisely how proteins, RNA, and other biomolecules interact with DNA.
Which is exciting. But even for those of us who are not researchers, the new approach gives us a whole new way to do something else: to see where we came from.
http://popular-archaeology.com/issue/spring-2015/article/most-european-men-descend-from-a-handful-of-bronze-age-forefathers
Spring 2015, Cover Stories, Daily News
Most European men descend
from a handful of Bronze Age forefathers
Professor Jobling said: "The population expansion falls within the Bronze Age, which involved changes in burial practices, the spread of horse-riding and developments in weaponry. Dominant males linked with these cultures could be responsible for the Y chromosome patterns we see today."
In addition, past population sizes were estimated, and showed that a continuous swathe of populations from the Balkans to the British Isles underwent an explosion in male population size between 2,000 and 4,000 years ago.
This contrasts with previous results for the Y chromosome, and also with the picture presented by maternally-inherited mitochondrial DNA, which suggests much more ancient population growth.
http://www.bbc.com/news/science-environment-29213892
Europeans drawn from three ancient 'tribes'
The modern European gene pool was formed when three ancient populations mixed within the last 7,000 years, Nature journal reports. Blue-eyed, swarthy hunters mingled with brown-eyed, pale skinned farmers as the latter swept into Europe from the Near East.
But another, mysterious population with Siberian affinities also contributed to the genetic landscape of the continent. The findings are based on analysis of genomes from nine ancient Europeans. Agriculture originated in the Near East - in modern Syria, Iraq and Israel - before expanding into Europe around 7,500 years ago.
It really does look like the indigenous West European hunter gatherers had this striking combination of dark skin and blue eyes that doesn't exist any moreProf David Reich, Harvard Medical School Multiple lines of evidence suggested this new way of life was spread by a wave of migrants, who interbred with the indigenous European hunter-gatherers they encountered on the way.
But assumptions about European origins were based largely on the genetic patterns of living people. The science of analysing genomic DNA from ancient bones has put some of the prevailing theories to the test, throwing up a few surprises.
Genomic DNA contains the biochemical instructions for building a human, and resides within the nuclei of our cells.
In the new paper, Prof David Reich from the Harvard Medical School and colleagues studied the genomes of seven hunter-gatherers from Scandinavia, one hunter whose remains were found in a cave in Luxembourg and an early farmer from Stuttgart, Germany.
The hunters arrived in Europe thousands of years before the advent of agriculture, hunkered down in southern refuges during the Ice Age and then expanded during a period called the Mesolithic, after the ice sheets had retreated from central and northern Europe.
Their genetic profile is not a good match for any modern group of people, suggesting they were caught up in the farming wave of advance.
If you look at all the reconstructions of Mesolithic people on the internet, they are always depicted as fair skinned... This shows the oppositeProf Carles Lalueza-Fox, Institute of Evolutionary Biology (CSIC - UPF) However, their genes live on in modern Europeans, to a greater extent in the north-east than in the south.
The early farmer genome showed a completely different pattern, however. Her genetic profile was a good match for modern people in Sardinia, and was rather different from the indigenous hunters.
But, puzzlingly, while the early farmers share genetic similarities with Near Eastern people at a global level, they are significantly different in other ways. Prof Reich suggests that more recent migrations in the farmers' "homeland" may have diluted their genetic signal in that region today.
Prof Reich explained: "The only way we'll be able to prove this is by getting ancient DNA samples along the potential trail from the Near East to Europe... and seeing if they genetically match these predictions or if they're different.
"Maybe they're different - that would be extremely interesting."
The agricultural transition was a period of momentous cultural and demographic change Pigmentation genes carried by the hunters and farmers showed that, while the dark hair, brown eyes and pale skin of the early farmer would look familiar to us, the hunter-gatherers would stand out if we saw them on a street today.
"It really does look like the indigenous West European hunter gatherers had this striking combination of dark skin and blue eyes that doesn't exist any more," Prof Reich told BBC News.
Dr Carles Lalueza-Fox, from the Institute of Evolutionary Biology (CSIC - UPF) in Barcelona, Spain, who was not involved with the research, told BBC News: "If you look at all the reconstructions of Mesolithic people on the internet, they are always depicted as fair skinned. And the farmers are sometimes depicted as dark-skinned newcomers to Europe. This shows the opposite."
So where did fair pigmentation in present-day Europeans come from? The farmer seems to be on her way there, carrying a gene variant for light skin that's still around today.
"There's an evolutionary argument about this - that light skin in Europe is biologically advantageous for people who farm, because you need to make vitamin D," said David Reich.
"Hunters and gatherers get vitamin D through their food - because animals have a lot of it. But once you're farming, you don't get a lot of it, and once you switch to agriculture, there's strong natural selection to lighten your skin so that when it's hit by sunlight you can synthesise vitamin D."
This reconstruction shows the dark skin and blue eyes of a 7,000-year-old hunter from northern Spain When the researchers looked at DNA from 2,345 present day people, they found that a third population was needed to capture the genetic complexity of modern Europeans.
This additional "tribe" is the most enigmatic and, surprisingly, is related to Native Americans.
Hints of this group surfaced in an analysis of European genomes two years ago. Dubbed Ancient North Eurasians, this group remained a "ghost population" until 2013, when scientists published the genome of a 24,000-year-old boy buried near Lake Baikal in Siberia.
This individual had genetic similarities to both Europeans and indigenous Americans, suggesting he was part of a population that contributed to movements into the New World 15,000 years ago and Europe at a later date.
The ancient hunter from Luxembourg and the farmer from Germany show no signs of mixture from this population, implying this third ancestor was added to the continental mix after farming was already established in Europe.
The study also revealed that the early farmers and their European descendents can trace a large part of their ancestry to a previously unknown, even older lineage called Basal Eurasians. This group represents the earliest known population divergence among the humans who left Africa 60,000 years ago.
European Journal of Human Genetics - Abstract of article: The /`extremely ancient/' chromosome that isn/'t: a forensic bioinformatic investigation of Albert Perry/'s X-degenerate portion of the Y chromosome
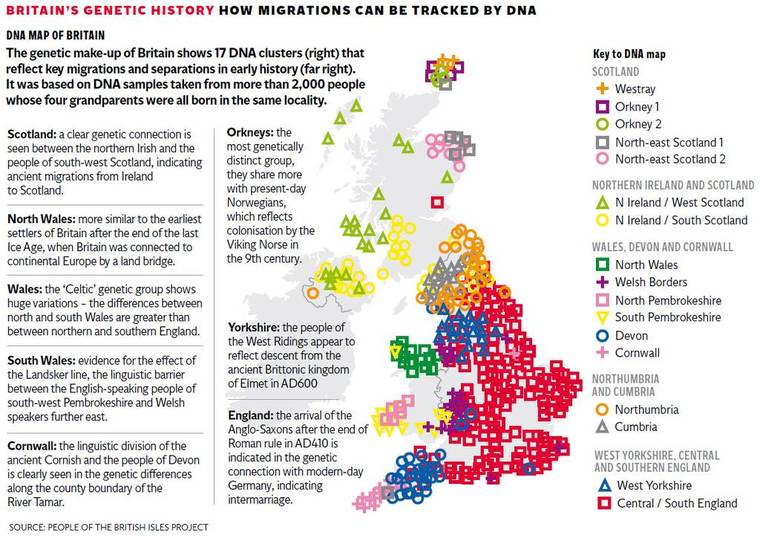
- Scientists found that Britain can be divided into 17 distinct genetic 'clans'
- The Welsh have the most DNA from the original settlers of the British Isles
- English genomes are a quarter German and 45 per cent French in origin
- French DNA dates from before the Norman conquests of Britain in 1066
- Despite their reputation for raping the Vikings left little trace of their DNA
- The ancient Romans also left little of their DNA behind after their conquest
- People in Cornwall and Devon form two distinct groups that rarely mixed
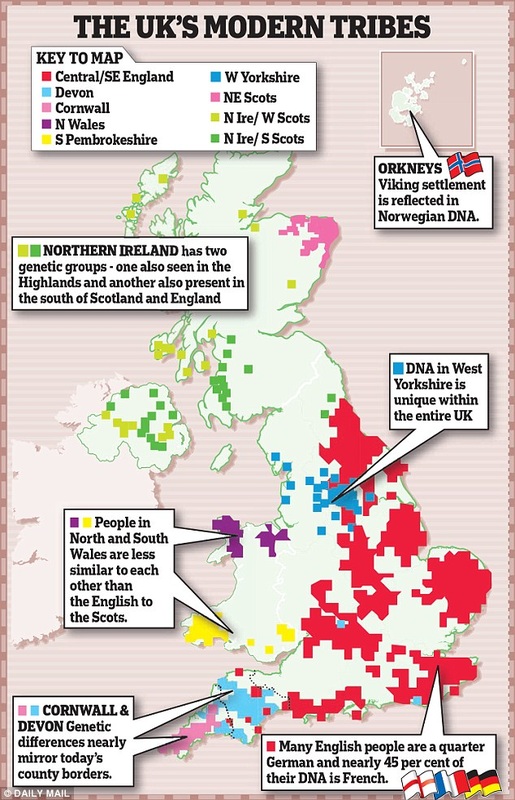
The study found that Britain can be divided into 17 distinct genetic 'clans', as shown in the map above
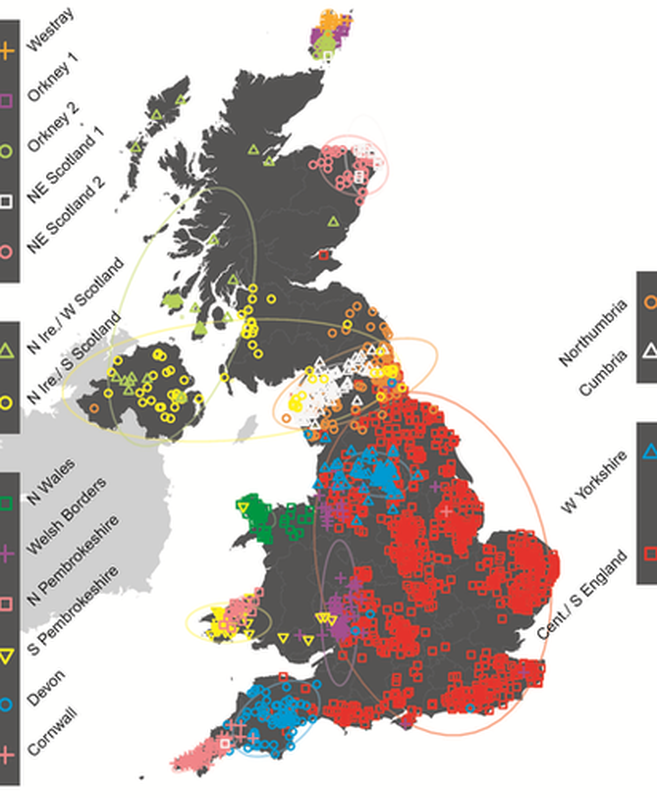
Who do you think you are? This genetic map might tell you. Each colour represents a different genetic group. Many correspond very closely to county borders, indicating a genetic basis for regional identities.
http://www.nature.com/news/ancient-european-genomes-reveal-jumbled-ancestry-1.14456
We sequenced the genomes of a ~7,000-year-old farmer from Germany and eight ~8,000-year-old hunter-gatherers from Luxembourg and Sweden. We analysed these and other ancient genomes1, 2, 3, 4 with 2,345 contemporary humans to show that most present-day Europeans derive from at least three highly differentiated populations: west European hunter-gatherers, who contributed ancestry to all Europeans but not to Near Easterners; ancient north Eurasians related to Upper Palaeolithic Siberians3, who contributed to both Europeans and Near Easterners; and early European farmers, who were mainly of Near Eastern origin but also harboured west European hunter-gatherer related ancestry. We model these populations’ deep relationships and show that early European farmers had ~44% ancestry from a ‘basal Eurasian’ population that split before the diversification of other non-African lineages.
ANTIC ROOTS, 2014
CAMBRIDGE, MASSACHUSETTS—A new genetic study by researchers from Harvard Medical School and the University of Tübingen suggests that early farmers from the Near East and indigenous hunter-gatherers were joined by a group known as Ancient North Eurasians as the ancestors of modern Europeans. The team analyzed the DNA of more than 2,300 modern people from around the world, and the DNA of eight ancient hunter-gatherers and one early farmer whose remains were recovered in Sweden, Luxembourg, and Germany. Previously gathered genetic sequences of humans from the same time period, including Otzi the Iceman, were also used in the study. “There was a sharp genetic transition between the hunter-gatherers and the farmers, reflecting a major movement of new people into Europe from the Near East,” David Reich of Harvard Medical School told Science Daily. The DNA of the two known Ancient North Eurasians, whose remains were discovered in Siberia, wasn’t found in either the hunter-gatherers or the early farmers, but nearly all Europeans have ancestors from all three groups. “The Ancient North Eurasian ancestry is proportionally the smallest component everywhere in Europe, never more than 20 percent, but we find in in nearly every European group we’ve studied and also in populations from the Caucasus and Near East,” he explained. (The same Ancient North Eurasian group has been linked to the ancestry of Native Americans.) An even older lineage called the Basal Eurasians, the ancestors of the ancient Near Eastern farmers, was discovered as well. “This deep lineage of non-African ancestry branched off before all the other non-Africans branched off from one another. Before Australian Aborigines and New Guineans and South Indians and Native Americans and other indigenous hunter-gatherers split, they split from Basal Eurasians,” Reich said. To read more on genetic lineages of Europeans, see ARCHAEOLOGY's "Seeds of Europe's Family Tree."
For 20 years, scientists have been attempting to connect modern Europeans’ genetic lineage to either Paleolithic hunter-gatherers who arrived before the last Ice Age, 22,000 years ago, or to the continent’s first farmers, who appeared 7,500 years ago, in the early Neolithic. Australian scientists now say that today’s Europeans may be related to an even later wave of settlers. Scientists retrieved mitochondrial DNA, which passes from mother to child, from the remains of 39 people recovered from archaeological digs in central Europe, covering a 3,500-year span throughout the Neolithic. They identified a particular complex of genes shared by 40 percent of the modern population. These genes display a level of diversity that did not exist among the early hunter-gatherers and was not prominent among the first farmers. It is in later periods of the Neolithic, from about 6,000 to 4,000 years ago, that today’s variants start to pop up regularly. According to Wolfgang Haak, a molecular archaeologist at the University of Adelaide, this tells us that early Neolithic farmers failed to cement their genetic legacy in central Europe, but that new settlers, possibly bringing related industries such as wool and dairy production, did. “It is not unlikely to assume a constant genetic influx from surrounding areas as settlement density increased towards the end the Neolithic,” Haak explains, “or that further technological advances arrived later.” http://www.archaeology.org/issues/96-1307/trenches/971-europe-dna-neolithic-settlement
http://www.washingtonpost.com/news/morning-mix/wp/2014/09/18/study-reveals-the-mysterious-ancestors-of-modern-europeans/
I am a direct descendent of someone of similar greatness: Charlemagne, Carolingian King of the Franks, Holy Roman Emperor, the great European conciliator. Quelle surprise! But we are all special, which means none of us are. If you’re vaguely of European extraction, you are also the fruits of Charlemagne’s prodigious loins. A fecund ruler, he sired at least 18 children by motley wives and concubines, including Charles the Younger, Pippin the Hunchback, Drogo of Metz, Hruodrud, Ruodhaid, and not forgetting Hugh.
This is merely a numbers game. You have two parents, four grandparents, eight great-grandparents, and so on. But this ancestral expansion is not borne back ceaselessly into the past. If it were, your family tree when Charlemagne was Le Grand Fromage would harbour more than a billion ancestors – more people than were alive then. What this means is that pedigrees begin to fold in on themselves a few generations back, and become less arboreal, and more web-like. In 2013, geneticists Peter Ralph and Graham Coop showed that all Europeans are descended from exactly the same people. Basically, everyone alive in the ninth century who left descendants is the ancestor of every living European today, including Charlemagne, Drogo, Pippin and Hugh. Quel dommage.
With the advent of cheap genetic sequencing, the deep, intimate history of everyone can be revealed. We carry the traces of our ancestors in our cells, and now, for the price of a secondhand copy of Burke’s Peerage, you can have your illustrious past unscrambled. Plenty of companies have emerged that provide this service, such as 23andMe and Ancestry DNA. Spit in a test tube, and they will match parts of your DNA with people from all over the world. The results are beguiling, but don’t necessarily show your geographical origins in the past. They show with whom you have common ancestry today.
People love discovering that they’re a bit Viking, or a bit Saracen. This is big business nowadays, and some companies spin fabulous yarns about your forebears as marketing devices. I’ve been making a documentary for Radio 4 on what genetics can and can’t tell you about ancestry, and examining some of the more outlandish claims that some ancestry businesses make. One company offered a service whereby it would tell you the precise village location of your genetic ancestry 1,000 years ago. It’s a peculiar thing to claim, as you will have thousands of ancestors 1,000 years ago, and I’m pretty sure they won’t have all come from the same village. Their algorithm clearly needed some work: it placed the genetic origin of one paying customer in the depths of the Humber estuary.
The truth is that we all are a bit of everything, and we come from all over. If you’re white, you’re a bit Viking. And a bit Celt. And a bit Anglo-Saxon. And a bit Charlemagne. This is not to disparage genetic genealogy and ancestry. Done right, it is an immensely powerful tool for studying families and human migrations. DNA can disclose unknown cousins or parents. Further back, the past becomes dimmer, but not invisible. A dazzling, detailed analysis of the British genome last month scrutinised the history of immigration over the past 10,000 years. Expect many more studies like this from all over the world revealing all manner of dalliances from the foggy past.
Often genetic ancestry relies on the Y chromosome, which is inherited only via the paternal line, or mitochondrial DNA, which is only passed on from mothers. These make for persuasive – but often simplistic – analyses of ancestry. These two chunks of DNA make up 2% of your genome. But the other 98% has to come from somewhere too, and that is a pick-and-mix from all the rest of your ancestors.
Each subsequent generation, the contribution from an individual from your lineage becomes less. Professor Mark Thomas from University College London describes this dilution as “homeopathic”. After a few rounds of preparation, homeopathic dilutions contain no molecules of whatever the active ingredient is imagined to be. Genetic inheritance works in a similar way. Half of your genome comes from your mother and half from your father, a quarter from each of your grandparents. But because of the way the DNA deck is shuffled every time a sperm or egg is made, it doesn’t keep halving perfectly as you meander up through your family tree. If you’re fully outbred (which you aren’t), you should have 256 great-great-great-great-great-great-grandparents. But their genetic contribution to you is not equal. Before long, you will find ancestors from whom you bear no DNA. They are your family, your blood, but their genes have been diluted out of your bloodline. Even though you are directly descended from Charlemagne, you may well carry none of his DNA.
So what does this all mean? Ancestry is messy. Genetics is messy, but powerful. People are horny. Life is complex. Anyone who says differently is selling something. A secret history is hidden in the mosaics of our genomes, but caveat emptor. If you want to spend your cash on someone in a white coat telling you that you’re descended from Vikings or Saxons or Charlemagne or even Drogo of Metz, help yourself. I, or hundreds of geneticists around the world, will shrug and do it for free, and you don’t even need to spit in a tube.
The Business of Genetic Ancestry is on BBC Radio 4, Tuesday 26 May at 11am
Y-chromosomal Adam - Wikipedia, the free encyclopediaen.wikipedia.org/wiki/Y-chromosomal_AdamWikipediaIn human genetics, Y-chromosomal Adam (Y-MRCA) is an informal name given to the most recent common ancestor (MRCA) from whom all currently living ...What are Y-Chromosomal Adam and Mitochondrial Eve?
www.gotquestions.org/Chromosomal-Adam-Mitochondrial-Eve.html
While Y-Chromosomal Adam is believed to be the ancestor of every living man, Mitochondrial Eve is believed to be the mother of all living humans, male and ...
www.gotquestions.org/Chromosomal-Adam-Mitochondrial-Eve.html
While Y-Chromosomal Adam is believed to be the ancestor of every living man, Mitochondrial Eve is believed to be the mother of all living humans, male and ...
Getty image
RNA Dark Matter -
https://www.youtube.com/watch?v=KpKr3NVDDvM&feature=youtu.be
Implications of this research could represent one step towards solving the problem of "missing heritability" -- a concept that describes how most traits, including many diseases, cannot be accounted for by individual genes and seem to have their origins in regions of the genome that do not code for proteins. "It is difficult to pin down the source of a disease when the mutation maps to a region of the genome with no known function," Pugh said. "However, if such regions produce RNA then we are one step closer to understanding that disease."

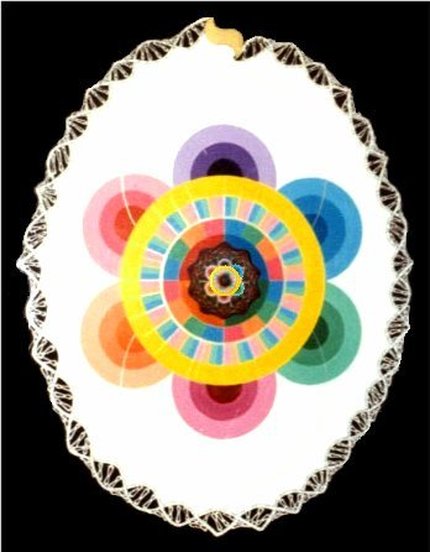
"The Sun Code of Genetic Programming," c1982, Iona Miller
The so-called sun-code of genetic programming. The codones (four genetic substances) should be read from the inside-out. The four color-coded substances (G, A, U, C), combine first in 16 ways (4 x 4), then in 64 ways (4 x 16). The magic number 64 immediately reminds us of the 64 Hexagrams of the I Ching, the Chinese synergetic book of life. In this painting, the Sun-Code occupies the place of Tiphareth, surrounded by its satellite Spheres of the Tree of Life. The surrounding DNA chain in the shape of the World Egg, is a variation of the alchemical tail-eating serpent Ourobouros. Its head is formed by the Hebrew Yod, a symbol of life and sperm, the unbroken circle of life.
The so-called sun-code of genetic programming. The codones (four genetic substances) should be read from the inside-out. The four color-coded substances (G, A, U, C), combine first in 16 ways (4 x 4), then in 64 ways (4 x 16). The magic number 64 immediately reminds us of the 64 Hexagrams of the I Ching, the Chinese synergetic book of life. In this painting, the Sun-Code occupies the place of Tiphareth, surrounded by its satellite Spheres of the Tree of Life. The surrounding DNA chain in the shape of the World Egg, is a variation of the alchemical tail-eating serpent Ourobouros. Its head is formed by the Hebrew Yod, a symbol of life and sperm, the unbroken circle of life.
http://www.messagetoeagle.com/genetichisteurope.php#.U8QeQrHDV-5
Unexplained Change In Europeans' DNA 4000-5000 Years Ago Remains A Mystery
Unexplained Change In Europeans' DNA 4000-5000 Years Ago Remains A Mystery
A new study indicates that the genetic markers of this first pan-European culture, were suddenly replaced around 4500 years ago. Scientists don't know why. A sudden genetic turnover that took place a few millennia ago remains unexplained. Ancient DNA recovered from a series of skeletons in central Germany up to 7500 years old has been used to reconstruct the first detailed genetic history of modern Europe.
A new study conducted by an international team of researchers at the University of Adelaide's Australian Centre for Ancient DNA (ACAD), that their colleagues from the University of Mainz, Germany and the National Geographic Society's Genographic Project, reveals a dramatic series of events including major migrations from both Western Europe and Eurasia, and signs of an unexplained genetic turnover about 4000-5000 years ago.
The research was performed at the University of Adelaide's Australian Centre for Ancient DNA (ACAD). Researchers used DNA extracted from bone and teeth samples from prehistoric human skeletons to sequence a group of maternal genetic lineages that are now carried by up to 45% of Europeans.
"This is the first high-resolution genetic record of these lineages through time, and it is fascinating that we can directly observe both human DNA evolving in 'real-time', and the dramatic population changes that have taken place in Europe," says joint lead author Dr Wolfgang Haak of ACAD.
"We can follow over 4000 years of prehistory, from the earliest farmers through the early Bronze Age to modern times."
"The record of this maternally inherited genetic group, called Haplogroup H, shows that the first farmers in Central Europe resulted from a wholesale cultural and genetic input via migration, beginning in Turkey and the Near East where farming originated and arriving in Germany around 7500 years ago," says joint lead author Dr Paul Brotherton, formerly at ACAD and now at the University of Huddersfield, UK.
"What is intriguing is that the genetic markers of this first pan-European culture, which was clearly very successful, were then suddenly replaced around 4500 years ago, and we don't know why. Something major happened, and the hunt is now on to find out what that was," ACAD Director Professor Alan Cooper said.
"We have established that the genetic foundations for modern Europe were only established in the Mid-Neolithic, after this major genetic transition around 4000 years ago," says Dr Haak.
"This genetic diversity was then modified further by a series of incoming and expanding cultures from Iberia and Eastern Europe through the Late Neolithic."
"The expansion of the Bell Beaker culture (named after their pots) appears to have been a key event, emerging in Iberia around 2800 BC and arriving in Germany several centuries later," says Dr Brotherton.
"This is a very interesting group as they have been linked to the expansion of Celtic languages along the Atlantic coast and into central Europe."
"These well-dated ancient genetic sequences provide a unique opportunity to investigate the demographic history of Europe," says Professor Cooper.
"We can not only estimate population sizes but also accurately determine the evolutionary rate of the sequences, providing a far more accurate timescale of significant events in recent human evolution."
The study is published in Nature Communications.
If the mitochondrial DNA of two humans, however distant geographically, exhibit the same mutation, they necessarily share a common ancestor in the maternal line.
Scientists believe that the “ginger gene,” or “V6OL allele,” showed up 50,000 years ago after humans left Africa for colder climates. This gene made human’s skin lighter, as they were exposed to less vitamin D from the sun. The scientists made this discovery having studied the gene evolution of 1,000 people from Spain.
Ten percent of Irish people have red hair. In total there are 20 million people in the United Kingdom and Ireland with the gene that can cause red hair and this new study shows that this remains a dominant gene in southern Europeans today.
However, this paler skin also brought health risks, such as melanoma, the deadliest form of cancer, but the study’s author Doctor Saioa Lopez says this is not necessarily due to the redhead gene itself.
He told the Daily Mail, “As a consequence of depigmentation there has been a collateral damage consequence to health.
“This can be reconciled if we assume that melanoma is typically a post-reproductive disease, and consequently should have little effect on the individual’s genetic contribution to the next generation.”
The recent study follows on the results of a ScotlandsDNA project in 2012 which found that the Celts flaming red hair can be put down to the weather. The experts believe that the gloomy climate in Scotland has seen a deliberate genetic adaptation. Essentially this means that red hair helps to take advantage of sunny days and allows the body to absorb more vitamin D.
Pedigree Collapse
We have about 43 genetic ancestors out of 1024 genealogical ancestors after 10 generations.
The probability of having DNA from all of your genealogical ancestors at a particular generation becomes vanishingly small very rapidly; there is a 99.6% chance that you will have DNA from all of your 16 great-great grandparents, only a 54% of sharing DNA with all 32 of your G-G-G grandparents, and a 0.01% chance for your 64 G-G-G-G grandparents. You only have to go back 5 generations for genealogical relatives to start dropping off your DNA tree.
We also care about how many genetic ancestors we have after a certain number of generations: The number of genetic ancestors starts off growing exponentially, but eventually flattens out to around 125 (at 10 generations, 120 of your 1024 genealogical ancestors are genetic ancestors).
The odds are in your favor of being able to prove a relationship with just about any other person, living or deceased. In fact the biggest challenge may be tracing your lineage past your grandfather or great grandfather. It seems that the farther back one goes, the more likelihood you are of finding a pedigree that extends many generations. Your ancestors increase exponentially each time you move back another generation.
Distant (and sometimes not all that distant) relations often marry. So your calculation effectively double-counts (and triple-counts, and quadruple-...) sets of great...grandparents.
Marriages generally occur between people of a similar geographical region, making it highly likely that there are not that many degrees of separation between them. Stated another way, there are many shared ancestors, so your binary tree model doesn't reflect reality.
We are all at least 50th cousins with each other.
The Common Ancestor of All Humans Lived 5,000 Years Ago
Olson and his colleagues found that if you go back a little farther — about 5,000 to 7,000 years ago — everybody living today has exactly the same set of ancestors.
In other words, every person who was alive at that time is either an ancestor to all 6 billion people living today, or their line died out and they have no remaining descendants.
"Had you entered any village on Earth in around 3,000 B.C., the first person you would have met would probably be your ancestor," Hein marveled.
It also means that all of us have ancestors of every color and creed.
http://michaelmarcotte.com/math.htm

http://ucsdnews.ucsd.edu/pressrelease/friends_are_the_family_you_choose
Friends Are the Family You Choose:
Genome-Wide Analysis Reveals Genetic Similarities Among Friends
If you consider your friends family, you may be on to something. A study from the University of California, San Diego, and Yale University finds that friends who are not biologically related still resemble each other genetically.
Published in the Proceedings of the National Academy of Sciences, the study is coauthored by James Fowler, professor of medical genetics and political science at UC San Diego, and Nicholas Christakis, professor of sociology, evolutionary biology, and medicine at Yale.
“Looking across the whole genome,” Fowler said, “we find that, on average, we are genetically similar to our friends. We have more DNA in common with the people we pick as friends than we do with strangers in the same population.”
The study is a genome-wide analysis of nearly 1.5 million markers of gene variation, and relies on data from the Framingham Heart Study. The Framingham dataset is the largest the authors are aware of that contains both that level of genetic detail and information on who is friends with whom.
The researchers focused on 1,932 unique subjects and compared pairs of unrelated friends against pairs of unrelated strangers. The same people, who were neither kin nor spouses, were used in both types of samples. The only thing that differed between them was their social relationship.
The findings are not, the researchers say, an artifact of people’s tendency to befriend those of similar ethnic backgrounds. The Framingham data is dominated by people of European extraction. While this is a drawback for some research, it may be advantageous to the study here: because all the subjects, friends and not, were drawn from the same population. The researchers also controlled for ancestry, they say, by using the most conservative techniques currently available. The observed genetic go beyond what you would expect to find among people of shared heritage – these results are “net of ancestry,” Fowler said.
Kissing cousins How similar are friends? On average, Fowler and Christakis find, friends are as “related” as fourth cousins or people who share great-great-great grandparents. That translates to about 1 percent of our genes.
“One percent may not sound like much to the layperson,” Christakis said, “but to geneticists it is a significant number. And how remarkable: Most people don’t even know who their fourth cousins are! Yet we are somehow, among a myriad of possibilities, managing to select as friends the people who resemble our kin.”
In the study, Fowler and Christakis also develop what they call a “friendship score,” which they can use to predict who will be friends at about the same level of confidence that scientists currently have for predicting, on the basis of genes, a person’s chances of obesity or schizophrenia.
Friends with benefits Shared attributes among friends or “functional kinship” can confer a variety of evolutionary advantages. In the simplest terms: If your friend feels cold when you do and builds a fire, you both benefit.
It is also the case that some traits only work if your friend also has them, Fowler said: “The first mutant to speak needed someone else to speak to. The ability is useless if there’s no one who shares it. These types of traits in people are a kind of social network effect.”
Beyond the average similarities across the whole genome, Fowler and Christakis looked in the study at focused sets of genes. They find that friends are most similar in genes affecting the sense of smell. The opposite holds for genes controlling immunity. That is, friends are relatively more dissimilar in their genetic protection against various diseases.
The immunity finding supports what others have recently found in regards to spouses. And there is a fairly straightforward evolutionary advantage to this, Fowler and Christakis say: Having connections to people who are able to withstand different pathogens reduces interpersonal spread. But how it is that we select people for this benefit of immunity? The mechanism still remains unclear.
Also open to debate and also needing further research is why we might be most similar in our olfactory genes. It could be, Fowler said, that our sense of smell draws us to similar environments. It is not hard to imagine that people who like the scent of coffee, for example, hang out at cafes more and so meet and befriend each other. But the researchers suspect there is more to the story than that.
They note, too, that most likely there are several mechanisms, operating both in concert and in parallel, driving us to choose genetically similar friends.
With a little help from our friends Perhaps the most intriguing result in the study is that genes that were more similar between friends seem to be evolving faster than other genes. Fowler and Christakis say this may help to explain why human evolution appears to have speeded up over the last 30,000 years, and they suggest that the social environment itself is an evolutionary force.
“The paper also lends support to the view of human beings as ‘metagenomic,’” Christakis said, “not only with respect to the microbes within us but also to the people who surround us. It seems that our fitness depends not only on our own genetic constitutions, but also on the genetic constitutions of our friends.”
The research was supported by grants from the National Institute on Aging (P-01 AG031093) and the National Institute for General Medical Sciences (P-41 GM103504-03).

EPIGENETICS
http://www.greenmedinfo.com/blog/no-sex-required-body-cells-transfer-genetic-info-directly-sperm-cells-amazing?page=2
The researchers concluded that their study's findings strongly suggest, "exosomes are the carriers of a flow of information from somatic cells to gametes," and that their "results indicate that somatic RNA is transferred to sperm cells, which can therefore act as the final recipients of somatic cell-derived information."
Breaking Through Weismann's Genetic Barrier
These findings overturn the so-called Weismann barrier, a principle proposed by the German evolutionary biologist August Weismann (1834 – 1914), that states hereditary information can only move from genes to body cells, and not the other way around, which has long been considered a nail in the coffin of the Lamarkian concept that an organism can pass on characteristics it has acquired during its lifetime to its offspring.
Over the past decade, however, the seeming impenetrability of the Weismann barrier has increasingly been called into question, due to a growing body of evidence that epigenetic patterns of gene expression (e.g. histone modifications, gene silencing via methylation) can be transferred across generations without requiring changes in the primary DNA sequences of our genomes; as well as the discovery that certain viruses contain the enzyme reverse transcriptase, which is capable of inscribing RNA-based information directly into our DNA, including germline cells, as is the case for endogenous retroviruses, which are believed responsible for about 5% of the nucleotide sequences in our genome. Nonetheless, as the authors of the new study point out, until their study, "no instance of transmission of DNA- or RNA-mediated information from somatic to germ cells has been reported as yet."
"Work from our and other laboratories indicates that spermatozoa act as vectors not only of their own genome, but also of foreign genetic information, based on their spontaneous ability to take up exogenous DNA and RNA molecules that are then delivered to oocytes at fertilization with the ensuing generation of phenotypically modified animals [35]–[37]. In cases in which this has been thoroughly investigated, the sperm-delivered sequences have been seen to remain extrachromosomal and to be sexually transmitted to the next generation in a non-Mendelian fashion [38]. The modes of genetic information delivery in this process are closely reminiscent of those operating in RNA-mediated paramutation inheritance, whereby RNA is the determinant of inheritable epigenetic variations [16], [17]. In conclusion, this work reveals that a flow of information can be transferred from the soma to the germline, escaping the principle of the Weismann barrier [39] which postulates that somatically acquired genetic variations cannot be transferred to the germline."
The implications of research on exosome-mediated information transfer are wide ranging. First, if your somatic cells, which are continually affected by your nutritional, environmental, lifestyle and even mind-body processes, can transfer genetic information through exosomes to the DNA within your germline cells, then your moment-to-moment decisions, behaviors, experiences, toxin and toxicant exposures, could theoretically affect the biological 'destinies' of your offspring, and their offspring, stretching on into the distant future.
Exosome research also opens up promising possibilities in the realm of nutrigenomics and 'food as medicine.' A recent study found common plant foods, e.g. ginger, grapefruit, grapes, produce exosomes that, following digestion, enter human blood undegraded and subsequently down-regulate inflammatory pathways in the human body in a manner confirming some of their traditional folkloric medicinal uses. If the somatic cells within our body are capable through extrachromosomal processes of modulating fundamental genetic processes within the germline cells, or, furthermore, if foods that we eat are also capable of acting as vectors of gene-regulatory information, truly the old reductionist, mechanistic, unilinear models of genetics must be abandoned in favor of a view that accounts for the vital importance of all our decisions, nutritional factors, environmental exposures, etc., in determining the course, not only of our bodily health, but the health of countless future generations as well.
It took 25 scientists two contentious days to come up with: "a locatable region of genomic sequence, corresponding to a unit of inheritance, which is associated with regulatory regions, transcribed regions and/or other functional sequence regions." Meaning that a gene is a discrete bit of DNA that we can point to and say, "that makes something, or regulates the making of something". The definition has a lot of wiggle room by design; it wasn't long ago that we thought that most of our DNA didn't do anything at all. We called it "junk DNA", but we're discovering that much of that junk has purposes that weren't immediately obvious.
Typically "gene" is misused most when followed by "for". There's two problems with this. We all have genes for hemoglobin, but we don't all have sickle cell anemia. Different people have different versions of the hemoglobin gene, called alleles. There are hemoglobin alleles which are associated with sickle cell diseases, and others that aren't. So, a gene refers to a family of alleles, and only a few members of that family, if any, are associated with diseases or disorders. The gene isn't bad - trust me, you won't live long without hemoglobin - though the particular version of hemoglobin that you have could be problematic.
There is an incorrect idea that when a genetic variation is correlated with something, it is the "gene for" that something. The language suggests that "this gene causes heart disease", when the reality is usually, "people that have this allele seem to have a slightly higher incidence of heart disease, but we don't know why, and maybe there are compensating advantages to this allele that we didn't notice because we weren't looking for them".
Research suggests that he yDNA haplogroups of the Graal Bloodlines include but are not limited to G2a, R1b1a2, Q1b, J-P209, and I2b1.
The mtDNA haplogroups include I2, H1, X, U6a1 and U6b1.
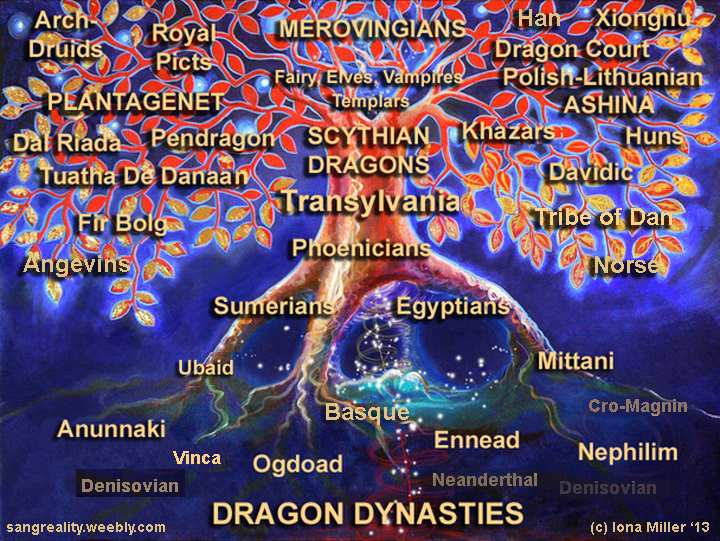

Y Haplogroups
[Male descent]
In molecular evolution, a haplogroup (from the Greek: ἁπλούς, haploûs, "onefold, single, simple") is a group of similar haplotypes that share a common ancestor having the same single nucleotide polymorphism (SNP) mutation in all haplotypes.
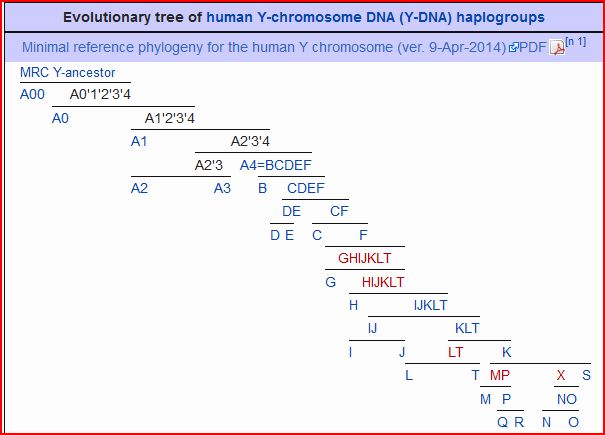
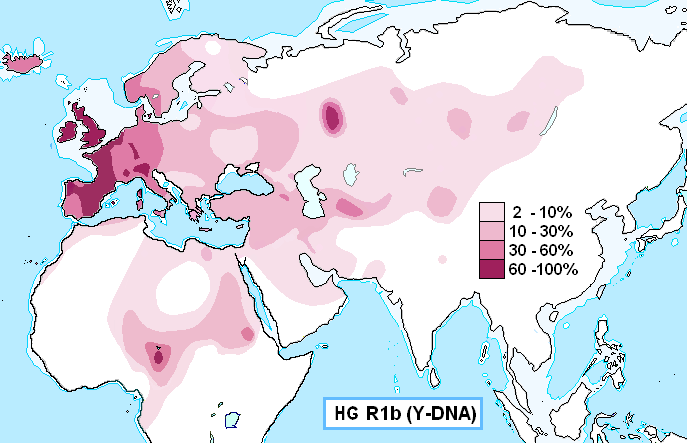
Haplotype R1b
http://en.wikipedia.org/wiki/Haplogroup_R1b_%28Y-DNA%29
Haplogroup R1b (Y-DNA) is the dominant paternal lineage of Western Europe. In human genetics, Haplogroup R1b is the most frequently occurring Y-chromosome haplogroup in Western Europe and in parts of sub-Saharan Central Africa (for example around Chad and Cameroon). R1b is also present at lower frequencies throughout Eastern Europe, Western Asia, Central Asia, and parts of North Africa, South Asia, and Siberia. Due to European emigration it also reaches high frequencies in the Americas and Australia. While Western Europe is dominated by the R1b1a2 (R-M269) branch of R1b, the Chadic-speaking area in Africa is dominated by the branch known as R1b1c (R-V88). These represent two very successful "twigs" on a much bigger "family tree."
The point of origin of R1b is thought to lie in Eurasia, most likely in Western Asia.[7] T. Karafet et al. estimated the age of R1, the parent of R1b, as 18,500 years before present.[1]
Early research focused upon Europe. In 2000 Ornella Semino and colleagues argued that R1b had been in Europe before the end of the Ice Age, and had spread north from an Iberian refuge after the Last Glacial Maximum.[8] Age estimates of R1b in Europe have steadily decreased in more recent studies, at least concerning the majority of R1b, with more recent studies suggesting a Neolithic age or younger.[7][9][10][11] Only Morelli et al. have recently attempted to defend a Palaeolithic origin for R1b1b2.[12] Irrespective of STR coalescence calculations, Chikhi et al. pointed out that the timing of molecular divergences does not coincide with population splits; the TMRCA of haplogroup R1b (whether in the Palaeolithic or Neolithic) dates to its point of origin somewhere in Eurasia, and not its arrival in western Europe.[1]
Barbara Arredi and colleagues were the first to point out that the distribution of R1b STR variance in Europe forms a cline from east to west, which is more consistent with an entry into Europe from Western Asia with the spread of farming.[11] A 2009 paper by Chiaroni et al. added to this perspective by using R1b as an example of a wave haplogroup distribution, in this case from east to west.[13] The proposal of a southeastern origin of R1b were supported by three detailed studies based on large datasets published in 2010. These detected that the earliest subclades of R1b are found in western Asia and the most recent in western Europe.[7][9][14] While age estimates in these articles are all more recent than the Last Glacial Maximum, all mention the Neolithic, when farming was introduced to Europe from the Middle East as a possible candidate period. Myres et al. (August 2010), and Cruciani et al. (August 2010) both remained undecided on the exact dating of the migration or migrations responsible for this distribution, not ruling out migrations as early as the Mesolithic or as late as Hallstatt but more probably Late Neolithic.[7] They noted that direct evidence from ancient DNA may be needed to resolve these gene flows.[7] Lee et al. (May 2012) analysed the ancient DNA of human remains from the Late Neolithic Bell Beaker site of Kromsdorf, Germany identifying two males as belonging to the Y haplogroup R1b.[15] Analysis of ancient Y DNA from the remains of populations derived from early Neolithic settlements such as the Mediterranean Cardium and Central and North European LBK settlements have found an absence of males belonging to haplogroup R1b.[16][17] At least one source now identifies haplogroup R1b with the western Indo-Europeans (Celts, Italics, and one of the three founding lines for the Germanics), with a chalcolithic or early Bronze Age arrival time.
European R1b is now known to be dominated by R-M269.
R1b* (that is R1b with no subsequent distinguishing SNP mutations) is extremely rare. The only population yet recorded with a definite significant proportion of R1b* are the Kurds of southeastern Kazakhstan with 13%.[7] However, more recently, a large study of Y-chromosome variation in Iran, revealed R1b* as high as 4.3% among Persian sub-populations.[18] In a study of Jordan it was found that no less than 20 out of all 146 men tested (13.7%), including most notably 20 out of 45 men tested from the Dead Sea area, were positive for M173 (R1) but negative for P25 and M269, mentioned above, as well as the R1a markers SRY10831.2 and M17, a study indicates that they are all R1b2-v88 [2].[19] Hassan et al. (2008) found an equally surprising 14 out of 26 (54%) of Sudanese Fulani who were M173+ and P25-.[20] Wood et al. report 2 Egyptian cases of R1-M173 which were negative for SRY10831 (R1a1) and P25 (R1b1), out of a sample of 1,122 males from various African countries, including 92 from Egypt.[21] Such cases could possibly be either R1b* (R-M343*) or R1a* (R-M420*) (demonstrating the importance of checking exact mutations tested when comparing findings in this field).
It is however also possible that some of the rare examples represent a reversion of marker P25 from a positive back to a negative ancestral state.[22]
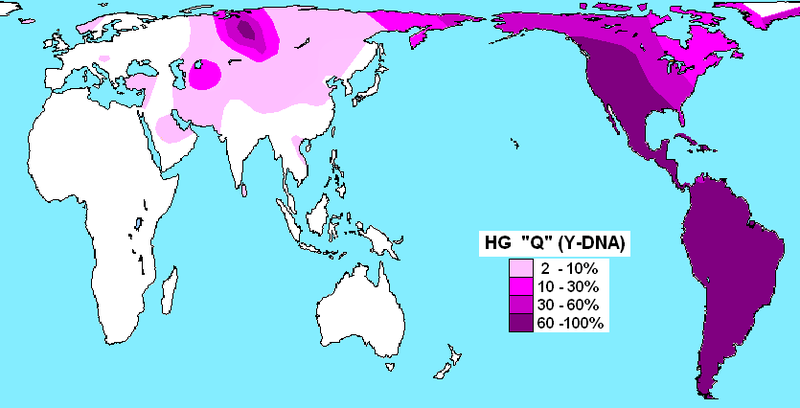
Q1b Subclades
http://thewatchers.adorraeli.com/2014/05/22/earth-and-moon-pass-through-comet-linear-dust-trail-may-24-live/?utm_source=dlvr.it&utm_medium=facebook
https://www.academia.edu/7117246/The_update_of_the_phylogenetic_structure_of_Q1b_haplogroup_based_on_full_Y-chromosome_sequencing
The undertaken research resulted in the up-date of Q1b (Q-L275) haplogroup structure, as well as in identifying new subclades: Q-Y2990 (downstream Q-Y2250), Q-Y2225 (downstream Q-Y2220) and Q-Y3030 (downstream Q-Y2200).
http://www.dailykos.com/story/2011/09/29/1021233/-Khazars-and-Jews
Due to presence of people belonging to Q-L275 haplogroup in habited Central Asia by the close of the 1st millennium B.C. PaleoDNA research shows the territory of contemporary Pakistan and Afghanistan were transit zones which presented the main migration routes of the Indo-European tribes (which also included representatives of Q-L275 haplogroup) to Hindustan through the Hindu Kush (Q-Y1150), as well as in the direction of Western Asia (Q-Y2250 and Q-L245). The research of paleoDNA performed by Chinese scientists based on the findings of archaeological excavations in Central Asia demonstrates the presence of Q haplogroup representatives in these lands; Q1a and Q1b were found in the Black Gouliang barrow to the east of the Barkol Basin at the ruins of Hami (Kumul). With regard to the location of bodies in the barrow, it may be concluded that representatives of Q1b haplotype were of a higher social status.
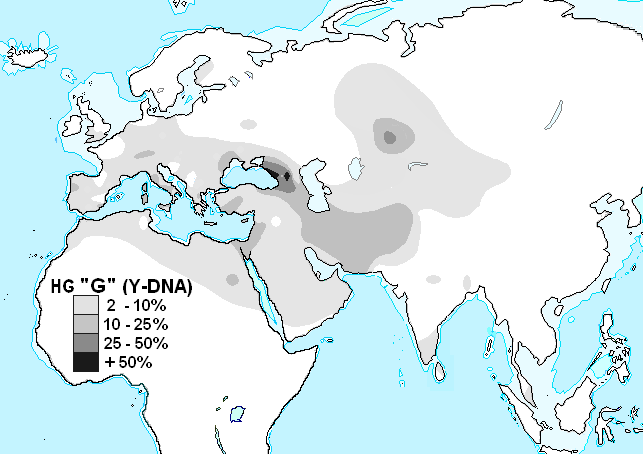
Haplotype G2a
http://en.wikipedia.org/wiki/Haplogroup_G-M201
Two men found in a high-status burial at Ergolding in present-day Bavaria, southern Germany, of the Merovingian dynasty period (7th century),[9] were found to belong to haplogroup G2a (P15+).Various estimated dates and locations have been proposed for the origin of Haplogroup G. The National Geographic Society places haplogroup G origins in the Middle East 30,000 years ago and presumes that people carrying the haplogroup took part in the spread of the Neolithic[2] Two scholarly papers have also suggested an origin in the Middle East, while differing on the date. Semino et al. (2000) suggested 17,000 years ago.[3] Cinnioglu et al. (2004) suggested the mutation took place only 9,500 years ago.[4]
Prehistoric presence
Haplogroup G2a(SNP P15+) has been identified in neolithic human remains in Europe dating between 5000-3000BC. Furthermore, the majority of all the male skeletons from the European Neolithic period have so far yielded Y-DNA belonging to this haplogroup. The oldest skeletons confirmed by ancient DNA testing as carrying haplogroup G2a were five found in the Avellaner cave burial site for farmers in northeastern Spain and were dated by radiocarbon dating to about 7000 years ago.[5] At the Neolithic cemetery of Derenburg Meerenstieg II, north central Germany, with burial artifacts belonging to the Linear Pottery culture, known in German as Linearbandkeramik (LBK). This skeleton could not be dated by radiocarbon dating, but other skeletons there were dated to between 5,100 and 6,100 years old. The most detailed SNP mutation identified was S126 (L30), which defines G2a3.[6] G2a was found also in 20 out of 22 samples of ancient Y-DNA from Treilles, the type-site of a Late Neolithic group of farmers in the South of France, dated to about 5000 years ago.[7] The fourth site also from the same period is the Ötztal of the Italian Alps where the mummified remains of Ötzi the Iceman were discovered. Preliminary word is that the Iceman belongs to haplogroup G2a2b [8] (earlier called G2a4).
Haplogroup G2a2b is a rare group today in Europe. The authors of the Spanish study indicated that the Avellaner men had rare marker values in testing of their short tandem repeat (STR) markers.
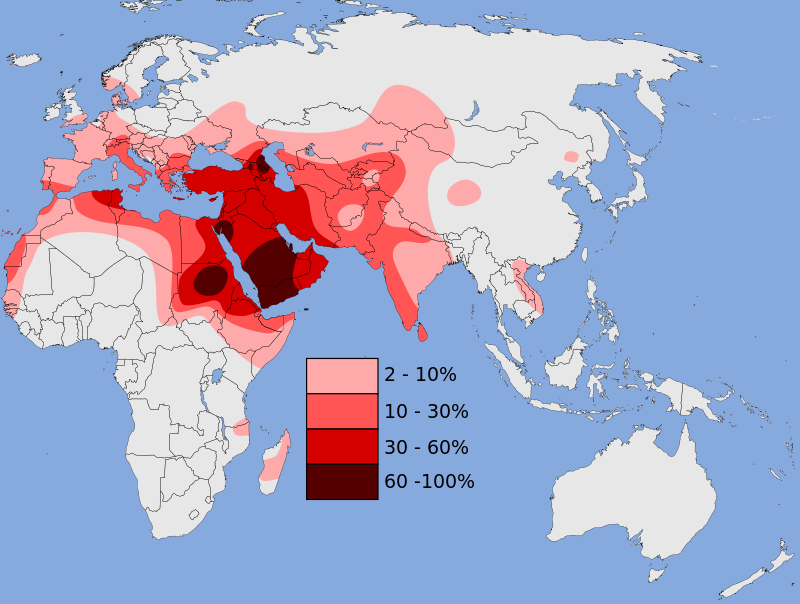
Haplogroup J-P209
Jewish and Middle Eastern non-Jewish populations share a common pool of Y-chromosome biallelic haplotypes. There is a remarkable similarity in Y-chromosome haplotype composition and average frequency in Jewish and non-Jewish Middle Eastern populations. Citing Autosomal DNA studies, Nicholas Wade estimates that "Ashkenazic and Sephardic Jews have roughly 30 percent European ancestry, with most of the rest from the Middle East."
Approximately 35% to 43% of Jewish men are in the paternal line known as haplogroup J and its sub-haplogroups. This Haplogroup is particularly present in the Middle East, Southern Europe, and Northern Africa.[28] Fifteen to 30% are in haplogroup E1b1b, (or E-M35) and its sub-haplogroups. The frequency of haplogroup R1b in the Ashkenazim population is similar to the frequency of R1b in Middle Eastern populations. Given that haplogroup R1b is particularly abundant in populations of Western Europe, studies of Nebel et al. (2001) and Behar et al. (2004)[31] suggest some Western European contribution to those ~10% of R1b found among Ashkenazim.
In molecular evolution, a haplogroup (from the Greek: ἁπλούς, haploûs, "onefold, single, simple") is a group of similar haplotypes that share a common ancestor having the same single nucleotide polymorphism (SNP) mutation in all haplotypes. Haplogroup J-P209[Phylogenetics 1] is a Y-chromosome DNA haplogroup. Its history since the Iron Age has been tied to the great events and migrations in this area and in particular to the Semitic people. J-P209 is divided into two main subclades (branches) J-M267 and J-M172.
Haplogroup J-P209 is believed to have arisen roughly 31,700 years ago in Southwest Asia (31,700±12,800 years ago according to Semino 2004). It is most closely related to Haplogroup I-M170, as both Haplogroup I-M170 and Haplogroup J-P209 are Haplogroup IJ subclades. Haplogroup IJ and haplogroup K derive from Haplogroup IJK, and only at this level of classification does haplogroup IJK join with Haplogroup G and Haplogroup H as immediate descendants of Haplogroup F. J-P209 is defined by the M304 genetic marker, or the equivalent 12f2.1 marker. The main current subgroups J-M267 and J-M172, which now comprise between them almost all of the population of the haplogroup, are both believed to have arisen very early, at least 10,000 years ago. Nonetheless, Y-chromosomes F-M89* and IJ-M429* were reported to have been observed in the Iranian plateau (Grugni et al. 2012). On the other hand, it would seem to be that different episodes of populace movement had impacted southeast Europe, as well as the role of the Balkans as a long-standing corridor to Europe from the Near East is shown by the phylogenetic unification of Hgs I and J by the basal M429 mutation. This proof of common ancestry suggests that ancestral Hgs IJ-M429* probably would have entered Europe through the Balkan track sometime before the LGM. They then subsequently split into Hg J and Hg I in Middle East and Europe in a typical disjunctive phylogeographic pattern. Such a geographic hall is prone to have encountered extra consequent gene streams, including the horticultural settlers. Moreover, the unification of haplogroups IJK creates evolutionary distance from F–H delegates, as well as supporting the inference that both IJ-M429 and KT-M9 arose closer to the Middle East than central or eastern Asia.
Y-Chromosomal Aaron
http://en.wikipedia.org/wiki/Y-chromosomal_Aaron
Y-chromosomal Aaron is the name given to the hypothesized most recent common ancestor of many of the patrilineal Jewish priestly caste known as Kohanim (singular "Kohen", "Cohen", or Kohane). In the Torah, this ancestor is identified as Aaron, the brother of Moses. The hypothetical most recent common ancestor was therefore dubbed "Y-chromosomal Aaron", by analogy to Y-chromosomal Adam.
The original scientific research was based on the discovery that a majority of present-day Jewish Kohanim either share, or are only one step removed from, a pattern of values for 6 Y-STR markers, which researchers named the Cohen Modal Haplotype (CMH). However it subsequently became clear that this six marker pattern was widespread in many communities where men had Y chromosomes which fell into Haplogroup J; the six-marker CMH was not specific just to Cohens, nor even just to Jews.
More recent research, using a larger number of Y-STR markers to gain higher resolution more specific genetic signatures, has indicated that about half of contemporary Jewish Kohanim, who share Y-chromosomal haplogroup J1c3 (also called J-P58), appear to be closely related. A further approximately 15% of Kohanim fall into a second distinct group, sharing a different but similarly tightly related ancestry. This second group fall under haplogroup J2a (J-M410). A number of other smaller lineage groups are also observed.
The J1-P58 and J2a possible Cohen clusters both include Cohens who are of both Sephardi and Ashkenazi background.
Although membership in the Jewish community has, since at least the second century CE, been passed maternally (see: Who is a Jew?), tribal identity, and membership in the group that originally comprised the Jewish priesthood (Cohen or Kohen; plural: Cohanim or Kohanim), has been patrilineal. Modern Kohanim claim descent from a biblical person, Aaron, brother of Moses, in the direct lineage from Levi, the patriarch of the Tribe of Levi, great grandson of Abraham, according to the tradition codified in the Tanakh (שמות / Sh'mot/Exodus 6). DNA testing is aiding scholars to trace the lineages found among modern Jewish populations, including contemporary Cohen families, to decipher origins of the people groups who were joined to the ancient Israelites and to identify genetic admixture and genetic drift.
For human beings, the normal number of chromosomes is 46, of which 23 are inherited from each parent. Two chromosomes, the X chromosome and Y chromosome, determine sex. Women have two X chromosomes, one inherited from their mother, and one inherited from their father. Men have an X chromosome inherited from their mother, and the Y chromosome inherited from their father.
Males who share a common patrilineal ancestor also share a Y chromosome, diverging only with respect to accumulated mutations. Since Y-chromosomes are passed from father to son, all Kohanim men should theoretically have almost identical Y chromosomes; this can be tested with a genealogical DNA test. As the rate that mutations accumulate on the Y chromosome is relatively constant, scientists can estimate the elapsed time since two men had a common ancestor. (See molecular clock.) "The Samaritan M267 lineages differed from the classical Cohen modal haplotype at DYS391, carrying 11 rather than 10 repeats", as well as, have a completely different haplogroup, which should have been "J1". Samaritan Kohanim descend from a different patrilineal family line, having haplogroup E1b1b1a (M78) (formerly E3b1a).[1]
Even within the Jewish Cohen population, it became clear that there were multiple different Cohen lineages, including distinctive lineages both in Haplogroup J1 and in haplogroup J2.[13] It also turned out that there were other unrelated groups of Jewish lineages in Haplogroup J2 which matched the original 6-marker CMH, but which were not associated with Cohens. Current estimates based on the accumulation of SNP mutations place the defining mutations that distinguish haplogroups J1 and J2 as having occurred about 20 to 30,000 years ago.
http://www.pnas.org/content/97/12/6769.long
In summary, the combined results suggest that a major portion of NRY biallelic diversity present in most of the contemporary Jewish communities surveyed here traces to a common Middle Eastern source population several thousand years ago. The implication is that this source population included a large number of distinct paternal and maternal lineages, reflecting genetic variation established in the Middle East at that time. In turn, this source diversity has been maintained within Jewish communities, despite numerous migrations during the Diaspora and long-term residence as isolated subpopulations in numerous geographic locations outside of the Middle East.
Haplotypes constructed from Y-chromosome markers were used to trace the paternal origins of the Jewish Diaspora. A set of 18 biallelic polymorphisms was genotyped in 1,371 males from 29 populations, including 7 Jewish (Ashkenazi, Roman, North African, Kurdish, Near Eastern, Yemenite, and Ethiopian) and 16 non-Jewish groups from similar geographic locations. The Jewish populations were characterized by a diverse set of 13 haplotypes that were also present in non-Jewish populations from Africa, Asia, and Europe.
A series of analyses was performed to address whether modern Jewish Y-chromosome diversity derives mainly from a common Middle Eastern source population or from admixture with neighboring non-Jewish populations during and after the Diaspora. Despite their long-term residence in different countries and isolation from one another, most Jewish populations were not significantly different from one another at the genetic level. Admixture estimates suggested low levels of European Y-chromosome gene flow into Ashkenazi and Roman Jewish communities. A multidimensional scaling plot placed six of the seven Jewish populations in a relatively tight cluster that was interspersed with Middle Eastern non-Jewish populations, including Palestinians and Syrians. Pairwise differentiation tests further indicated that these Jewish and Middle Eastern non-Jewish populations were not statistically different. The results support the hypothesis that the paternal gene pools of Jewish communities from Europe, North Africa, and the Middle East descended from a common Middle Eastern ancestral population, and suggest that most Jewish communities have remained relatively isolated from neighboring non-Jewish communities during and after the Diaspora.
Jewish religion and culture can be traced back to Semitic tribes that lived in the Middle East approximately 4,000 years ago. The Babylonian exile in 586 B.C. marked the beginning of major dispersals of Jewish populations from the Middle East and the development of various Jewish communities outside of present-day Israel (1). Today, Jews belong to several communities that can be classified according to the location where each community developed. Among others, these include the Middle Eastern communities of former Babylonia and Palestine, the Jewish communities of North Africa and the Mediterranean Basin, and Ashkenazi communities of central and eastern Europe. The history of the Jewish Diaspora—the numerous migrations of Jewish populations and their subsequent residence in various countries in Europe, North Africa, and West Asia—has resulted in a complex set of genetic relationships among Jewish populations and their non-Jewish neighbors. Several studies have attempted to describe these genetic relationships and to unravel the numerous evolutionary factors that have come into play during the Diaspora (2–11). Some of the key arguments in the literature concern the relative contributions of common ancestry, genetic drift, natural selection, and admixture leading to the observed similarities and differences among Jewish and non-Jewish communities.
Given the complex history of migration, can Jews be traced to a single Middle Eastern ancestry, or are present-day Jewish communities more closely related to non-Jewish populations from the same geographic area? Some genetic studies suggest that Jewish populations show substantial non-Jewish admixture and the occurrence of mass conversion of non-Jews to Judaism (2, 3, 10, 12). In contrast, other research points to considerably greater genetic similarity among Jewish communities with only slight gene flow from their respective host populations (5, 7, 9, 11, 13). Furthermore, it has been demonstrated that the degree of genetic similarity among Jewish communities and between Jewish and non-Jewish populations depends on the particular locus that is being investigated (4, 8, 11). This observation raises the possibility that variation associated with a given locus has been influenced by natural selection.
All of the aforementioned investigations used “classical” genetic markers such as blood groups, enzymes, and serum proteins, as well as immunoglobulins and the HLA system. More recently, restriction fragment length polymorphism studies were initiated by using mitochondrial DNA (mtDNA), the nonrecombining portion of the Y chromosome (NRY), and other nuclear loci (14–20). An advantage of nucleotide-level studies is that they circumvent some of the complications associated with selection; however, these studies have not fully resolved many of the key issues in the earlier literature.
Analyses of mtDNA and the NRY are especially relevant to studies of Jewish origins because, according to ancient Jewish law, Jewish religious affiliation is assigned maternally (1). In particular, studies of paternally inherited variation provide the opportunity to assess the genetic contribution of non-Jewish males to present-day Jewish genetic diversity. This research represents one of the first comparisons of biallelic variation on the NRY in Jewish and non-Jewish populations from similar geographic areas. We surveyed 18 biallelic polymorphisms in 7 Jewish and 22 non-Jewish populations from Europe, the Middle East, and Africa to assess the relative contributions of common ancestry, gene flow, and genetic drift in shaping patterns of NRY variation in populations of the Jewish Diaspora.
Haplotype Tree. During the course of this research, four Y-specific polymorphisms were discovered: a C→T transition at position 792 of DYS188 (DYS188792 C→T), a C→A transversion at position 469 of DYS194 (DYS194469 C→A), a C→T transition at position 136 of DYS221 (DYS221136 C→T) and an A→T transversion at position 105 of DYS211 (DYS211105 A→T). Comparisons with the homologous NRY sequences from great apes allowed us to infer the ancestral states at these sites. The character states at all 18 polymorphic sites gave rise to 19 Y-chromosome haplotypes in worldwide populations, 17 of which were present in the 1,371 Y-chromosomes sampled in this survey. Fig. 1 shows the evolutionary relationships among these 19 Y-chromosome haplotypes. We refer to the most basal haplotype defined by the DYS188792 C→T mutation as haplotype 1R. Three of the polymorphisms described here mark lineages that are descended from haplotype 1R: the p12f2 8-kb allele (Med haplotype), the DYS221136-T allele (haplotype 1Ha), and the DYS211105-T allele (haplotype 1Hb). Haplotype 1R is also the ancestor of a set of lineages defined by M9, an ancient C→G transversion polymorphism (26). The DYS194469-T allele defines a lineage (haplotype 1L) that is a member of the 1C clade, itself defined by the DYS257182 G→A transition (32). In previous haplotype trees (32), YAP+ haplotype 4 was differentiated from haplotype 3A by two mutational events. An intermediate haplotype with the PN2-T allele and the poly(A)-L allele provides evidence that the PN2 C→T transition occurred before the poly(A) L→S deletion. This haplotype, called YAP+ haplotype 4L (Fig. 1), was found only in seven Ethiopian males (Jewish and non-Jewish).
Evidence for Common Jewish Origins. Several lines of evidence support the hypothesis that Diaspora Jews from Europe, Northwest Africa, and the Near East resemble each other more closely than they resemble their non-Jewish neighbors. First, six of the seven Jewish populations analyzed here formed a relatively tight cluster in the MDS analysis (Fig. 2). The only exception was the Ethiopian Jews, who were affiliated more closely with non-Jewish Ethiopians and other North Africans. Our results are consistent with other studies of Ethiopian Jews based on a variety of markers (16, 23, 46). However, as in other studies where Ethiopian Jews exhibited markers that are characteristic of both African and Middle Eastern populations, they had Y-chromosome haplotypes (e.g., haplotypes Med and YAP+4S) that were common in other Jewish populations.
Second, despite their high degree of geographic dispersion, Jewish populations from Europe, North Africa, and the Near East were less diverged genetically from each other than any other group of populations in this study (Table 2). The statistically significant correlation between genetic and geographic distances in our non-Jewish populations from Europe, the Middle East, and North Africa is suggestive of spatial differentiation, whereas the lack of such a correlation for Jewish populations is more compatible with a model of recent dispersal and subsequent isolation during and after the Diaspora.
http://en.wikipedia.org/wiki/Genetic_studies_on_Jews
Studies of mitochondrial DNA of Jewish populations are more recent and are still debatable. However, it seems that there are no maternal lines common to all Jewish people.[10][Note 8] Until 2006, geneticists attributed most often the origin of Jewish populations to male individuals who emigrated from the Middle East and took women as wives in the indigenous populations, who later converted to Judaism.[11] D.M. Behar, et al. published a study in 2008 that tried to review this assertion.[52]
According to M.G. Thomas, et al. in 2002, a number of Jewish communities reveal direct-line maternal ancestry originating from a few women. This was seen in independently founded communities in different geographic areas. What they shared was limited genetic additions later on the female side. Together, this is described as the founder effect. Those same communities had diversity in the male lines that was similar to the non-Jewish population.[53]
Reflecting on previous mtDNA studies carried out by Behar, Atzmon et al. concludes that all major Jewish population groups are showing evidence for founder females of Middle Eastern origin with coalescence times >2000 years[12] A 2013 study, based on a much larger sample base, drew differing conclusions, namely, that the Mt-DNA of Ashkenazi Jews originated among European women of the Italian peninsula, where Diaspora communities had been established centuries before the fall of the Second Temple in 70 CE.[54]
A 2007 study by J. Feder et al.[56] confirms the hypothesis of the founding of non-local origin among the maternal lines. Their study did not address the geographical origin of Ashkenazim and therefore does not explicitly confirm the origin "Levantine" of these founders. This study revealed a significant divergence in total haplogroup distribution between the Ashkenazi Jewish populations and their European host populations, namely Russians, Poles and Germans. They concluded that, regarding mtDNAs, the differences between Jews and non-Jews are far larger than those observed among the Jewish communities. The study also found that "the differences between the Jewish communities can be overlooked when non-Jews are included in the comparisons." It supported previous interpretations that, in the direct maternal line, there was "little or no gene flow from the local non-Jewish communities in Poland and Russia to the Jewish communities in these countries."[57
A 2013 study at the University of Huddersfield, led by Professor Martin B. Richards, concluded that 65%-81% of Ashkenazi Mt-DNA is European in origin, including all four founding mothers, and that most of the remaining lineages are also European. The results were published in Nature Communications in October 2013. The team analyzed about 2,500 complete and 28,000 partial Mt-DNA genomes of mostly non-Jews, and 836 partial Mt-DNA genomes of Ashkenazi Jews. The study claims that only 8% of Ashkenazi Mt-DNA is Middle Eastern in origin, and the origin of the rest is unclear.[54]
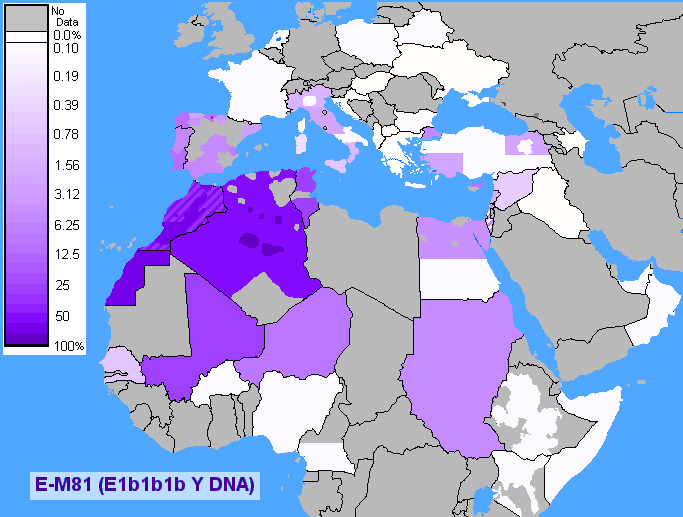
Haplogroup E
Possible time of origin approx 22,400 years BP
http://en.wikipedia.org/wiki/Haplogroup_E-M215_%28Y-DNA%29
Possible time of origin approx 22,400 years BP
http://en.wikipedia.org/wiki/Haplogroup_E-M215_%28Y-DNA%29
In human genetics, Y Haplogroup E-M215, also referred to in the literature by other names such as E1b1b and E3b (see further discussion below), is a major Y-chromosome haplogroup. It is a division of the macro haplogroup E-M96, which is defined by the single nucleotide polymorphism (SNP) mutation M215.[4][5][6] In other words it is one of the major paternal lines of humanity, linking from father-to-son back to a common male-line ancestor. It is a subject of discussion and study in genetics as well as genetic genealogy, archaeology, and historical linguistics.
The E haplogroup has been observed in all Jewish groups world wide. One of its major subclades, E1b1b (formerly E3b) is considered to be the 2nd most prevalent haplogroup among the Jewish population.
According to one major paper, Contrasting patterns of Y chromosome variation in Ashkenazi Jewish and host non-Jewish European populations E-M35, which defines the E1b1b1 (formerly E3b1) haplogroup, is considered to be the second highest, next to J, for "Founding Jewish Lineages" in Europe. It is found in moderate amounts in all Jewish populations, from Ashkenazi, Sephardic, Kurdish, Yemen, Samaritan and even among Djerba Jewish groups.
E-M215 has two ancient branches that contain all known modern E-M215 men, E-M35 and E-M281. Of these two, the only branch that has been confirmed in a native population outside of Ethiopia is E-M35, which in turn has four known branches, E-V68, E-Z827, E-V6 and E-V92. The first two, E-V68 and E-Z827 contain by far the majority of all modern E-M215 men. E-V68 and E-V257 have been found in highest numbers in North Africa and the Horn of Africa; but also in lower numbers in parts of the Middle East and Europe, and in isolated populations of Southern Africa. The remaining two branches, E-V6 and E-V92 have mostly been observed in Ethiopia.

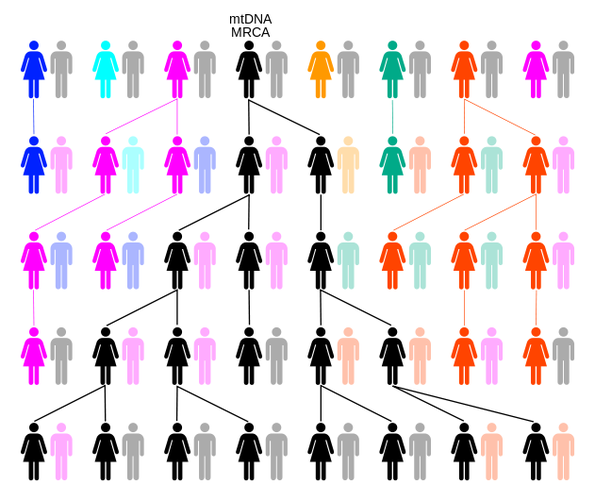
Through random drift or selection the female-lineage will trace back to a single female, such as Mitochondrial Eve. In this example over five generations colors represent extinct matrilineal lines and black the matrilineal line descended from mtDNA MRCA.
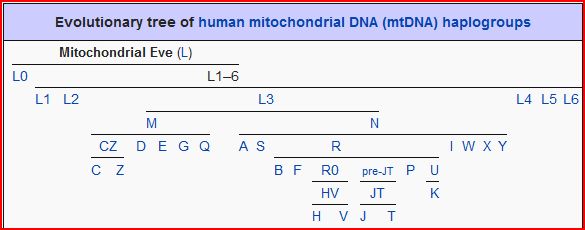
Mitochondrial DNA
[Descent through the mothers; unchanging for 15 generations]
In most species, including humans, mtDNA is inherited solely from the mother.
The Seven Daughters of Eve
presents the theory of human mitochondrial genetics to a general audience
http://en.wikipedia.org/wiki/Mitochondrial_DNA
Mitochondrial DNA (mtDNA or mDNA)[2] is the DNA located in organelles called mitochondria, structures within eukaryotic cells that convert chemical energy from food into a form that cells can use, adenosine triphosphate (ATP). Mitochondrial DNA is only a small portion of the DNA in a eukaryotic cell; most of the DNA can be found in the cell nucleus, and in plants, the chloroplast as well. In humans, mitochondrial DNA can be assessed as the smallest chromosome coding for 37 genes and containing approximately 16,600 base pairs. Human mitochondrial DNA was the first significant part of the human genome to be sequenced.
The DNA sequence of mtDNA has been determined from a large number of organisms and individuals (including some organisms that are extinct), and the comparison of those DNA sequences represents a mainstay of phylogenetics, in that it allows biologists to elucidate the evolutionary relationships among species. It also permits an examination of the relatedness of populations, and so has become important in anthropology and field biology.
Unlike nuclear DNA, which is inherited from both parents and in which genes are rearranged in the process of recombination, there is usually no change in mtDNA from parent to offspring. Although mtDNA also recombines, it does so with copies of itself within the same mitochondrion. Because of this and because the mutation rate of animal mtDNA is higher than that of nuclear DNA,[32] mtDNA is a powerful tool for tracking ancestry through females (matrilineage) and has been used in this role to track the ancestry of many species back hundreds of generations.
The definition of mitochondrial Eve is fixed, but the person in prehistory who will fit this definition can change, not only because of new discoveries, but also because of unbroken mother-daughter lines coming to an end by chance. It follows from the definition of Mitochondrial Eve that she had at least two daughters who both have unbroken female lineages that have survived to the present day. In every generation mitochondrial lineages end – when a woman with unique mtDNA dies with no daughters. When the mitochondrial lineages of daughters of mitochondrial Eve die out, then the title of "Mitochondrial Eve" shifts forward from the remaining daughter through her matrilineal descendants, until the first descendant is reached who had at least two daughters who both have living, matrilineal descendants. Once a lineage has died out it is irretrievably lost and this mechanism can thus only shift the title of "Mitochondrial Eve" forward in time.
Not necessarily a contemporary of "Y-chromosomal Adam" Sometimes mitochondrial Eve is assumed to have lived at the same time as Y-chromosomal Adam, from whom all living people are descended patrilineally, perhaps even meeting and mating with him. Even if this were true, which is currently regarded as highly unlikely, this would only be a coincidence. Like mitochondrial "Eve", Y-chromosomal "Adam" probably lived in Africa. A recent study (March 2013) concluded however that "Eve" lived much later than "Adam" – some 140,000 years later.[10] (Earlier studies considered, conversely, that "Eve" lived earlier than "Adam".)[34] More recent studies indicate that mitochondrial Eve and Y-chromosomal Adam may indeed have lived around the same time.[35]
Not the most recent ancestor shared by all humans Main article: Most recent common ancestor Mitochondrial Eve is the most recent common matrilineal ancestor, not the most recent common ancestor. Since the mtDNA is inherited maternally and recombination is either rare or absent, it is relatively easy to track the ancestry of the lineages back to a MRCA; however, this MRCA is valid only when discussing mitochondrial DNA. An approximate sequence from newest to oldest can list various important points in the ancestry of modern human populations:
Although the original research did have analytical limitations, the results were not that seriously flawed.[48][49] However they should be interpreted, estimates of the age of the last common mitochondrial ancestor continue to be refined. A recent estimate (March 2013) from the Max Planck Institute for Evolutionary Anthropology shows that Mitochondrial Eve lived about 160,000 years ago (within the reserved estimate of the original research) and also that the non-African humans were separated from Africans about 95,000 years ago.[50] In August 2013, a study led by Stanford University School of Medicine geneticists reported the age of Mitochondrial Eve to be about 99,000 and 148,000 years, and the Y-MRCA to have lived between 120,000 and 156,000 years ago, based on genome sequencing of 69 people from 9 different populations.
[Descent through the mothers; unchanging for 15 generations]
In most species, including humans, mtDNA is inherited solely from the mother.
The Seven Daughters of Eve
presents the theory of human mitochondrial genetics to a general audience
http://en.wikipedia.org/wiki/Mitochondrial_DNA
Mitochondrial DNA (mtDNA or mDNA)[2] is the DNA located in organelles called mitochondria, structures within eukaryotic cells that convert chemical energy from food into a form that cells can use, adenosine triphosphate (ATP). Mitochondrial DNA is only a small portion of the DNA in a eukaryotic cell; most of the DNA can be found in the cell nucleus, and in plants, the chloroplast as well. In humans, mitochondrial DNA can be assessed as the smallest chromosome coding for 37 genes and containing approximately 16,600 base pairs. Human mitochondrial DNA was the first significant part of the human genome to be sequenced.
The DNA sequence of mtDNA has been determined from a large number of organisms and individuals (including some organisms that are extinct), and the comparison of those DNA sequences represents a mainstay of phylogenetics, in that it allows biologists to elucidate the evolutionary relationships among species. It also permits an examination of the relatedness of populations, and so has become important in anthropology and field biology.
Unlike nuclear DNA, which is inherited from both parents and in which genes are rearranged in the process of recombination, there is usually no change in mtDNA from parent to offspring. Although mtDNA also recombines, it does so with copies of itself within the same mitochondrion. Because of this and because the mutation rate of animal mtDNA is higher than that of nuclear DNA,[32] mtDNA is a powerful tool for tracking ancestry through females (matrilineage) and has been used in this role to track the ancestry of many species back hundreds of generations.
The definition of mitochondrial Eve is fixed, but the person in prehistory who will fit this definition can change, not only because of new discoveries, but also because of unbroken mother-daughter lines coming to an end by chance. It follows from the definition of Mitochondrial Eve that she had at least two daughters who both have unbroken female lineages that have survived to the present day. In every generation mitochondrial lineages end – when a woman with unique mtDNA dies with no daughters. When the mitochondrial lineages of daughters of mitochondrial Eve die out, then the title of "Mitochondrial Eve" shifts forward from the remaining daughter through her matrilineal descendants, until the first descendant is reached who had at least two daughters who both have living, matrilineal descendants. Once a lineage has died out it is irretrievably lost and this mechanism can thus only shift the title of "Mitochondrial Eve" forward in time.
Not necessarily a contemporary of "Y-chromosomal Adam" Sometimes mitochondrial Eve is assumed to have lived at the same time as Y-chromosomal Adam, from whom all living people are descended patrilineally, perhaps even meeting and mating with him. Even if this were true, which is currently regarded as highly unlikely, this would only be a coincidence. Like mitochondrial "Eve", Y-chromosomal "Adam" probably lived in Africa. A recent study (March 2013) concluded however that "Eve" lived much later than "Adam" – some 140,000 years later.[10] (Earlier studies considered, conversely, that "Eve" lived earlier than "Adam".)[34] More recent studies indicate that mitochondrial Eve and Y-chromosomal Adam may indeed have lived around the same time.[35]
Not the most recent ancestor shared by all humans Main article: Most recent common ancestor Mitochondrial Eve is the most recent common matrilineal ancestor, not the most recent common ancestor. Since the mtDNA is inherited maternally and recombination is either rare or absent, it is relatively easy to track the ancestry of the lineages back to a MRCA; however, this MRCA is valid only when discussing mitochondrial DNA. An approximate sequence from newest to oldest can list various important points in the ancestry of modern human populations:
- The Human MRCA. All humans alive today share a surprisingly recent common ancestor, perhaps even within the last 5,000 years, even for people born on different continents.[36]
- The Identical ancestors point. Just a few thousand years before the most recent single ancestor shared by all living humans was the time at which all humans who were then alive either left no descendants alive today or were common ancestors to all humans alive today. In other words, "each present-day human has exactly the same set of genealogical ancestors" alive at the "Identical ancestors point" in time. This is far more recent than Mitochondrial Eve.[36]
- Mitochondrial Eve, the most recent female-line common ancestor of all living people.
- "Y-chromosomal Adam", the most recent male-line common ancestor of all living people, is currently thought to have lived long before Mitochondrial Eve.
- is not a fixed individual
- had a mother
- was not the only woman of her time, and
- Y-chromosomal Adam is unlikely to have been her sexual partner, or indeed to have been contemporaneous to her.
Although the original research did have analytical limitations, the results were not that seriously flawed.[48][49] However they should be interpreted, estimates of the age of the last common mitochondrial ancestor continue to be refined. A recent estimate (March 2013) from the Max Planck Institute for Evolutionary Anthropology shows that Mitochondrial Eve lived about 160,000 years ago (within the reserved estimate of the original research) and also that the non-African humans were separated from Africans about 95,000 years ago.[50] In August 2013, a study led by Stanford University School of Medicine geneticists reported the age of Mitochondrial Eve to be about 99,000 and 148,000 years, and the Y-MRCA to have lived between 120,000 and 156,000 years ago, based on genome sequencing of 69 people from 9 different populations.

Epigenetic research reveals the following:
- Genetics are controlled by perception of our environment NOT genes.
- Genes do not control who you are nor your biological expression.
- Genes adapt to your beliefs and identities
- Genes cannot turn themselves on or off; the organism changes to adapt to the environment.
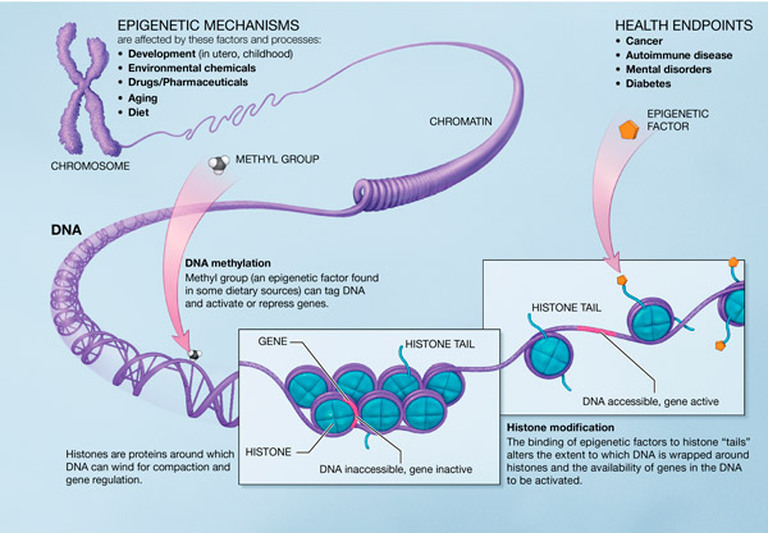
Coevolution of Mind & Culture
Cultural Forging of the Unconscious
In psychology, genetic memory is a memory present at birth that exists in the absence of sensory experience, and is incorporated into the genome over long spans of time. It is based on the idea that common experiences of a species become incorporated into its genetic code, not by a Lamarckian process that encodes specific memories but by a much vaguer tendency to encode a readiness to respond in certain ways to certain stimuli. Shares much with the modern concept of epigenetics.
Genetic memory is invoked to explain ethnic group memory postulated by Carl Jung. Jungian psychology suggests memories, feelings and ideas inherited from our ancestors as part of a "collective unconscious". The term "epigenetic" refers to heritable traits that do not involve changes to the underlying DNA sequence. This can occur over rounds of cell division, while some epigenetic features can effect transgenerational inheritance and are inherited from one generation to the next.
Multigenerational epigenetics is today regarded as another aspect to evolution and adaptation. Culture is the most fundamental force that has shaped man's life through the aeons. Its effect is, in all likelihood, established in the genome in a few generations.The concept implies that genes have a 'memory'; what you do in your lifetime, and what you are exposed to, could in turn affect your grandchildren.
Epigenetics adds a whole new layer to genes beyond the DNA, the so called "epigenome". Among other things, it proposes a control system of 'switches' that turn genes on or off. The things that people experience, like nutrition and stress, can control these switches and cause heritable effects in humans. The switches themselves can also be inherited. This means that a 'memory' of an event could be passed through generations. A simple environmental effect could switch genes on or off - and this change could be inherited.
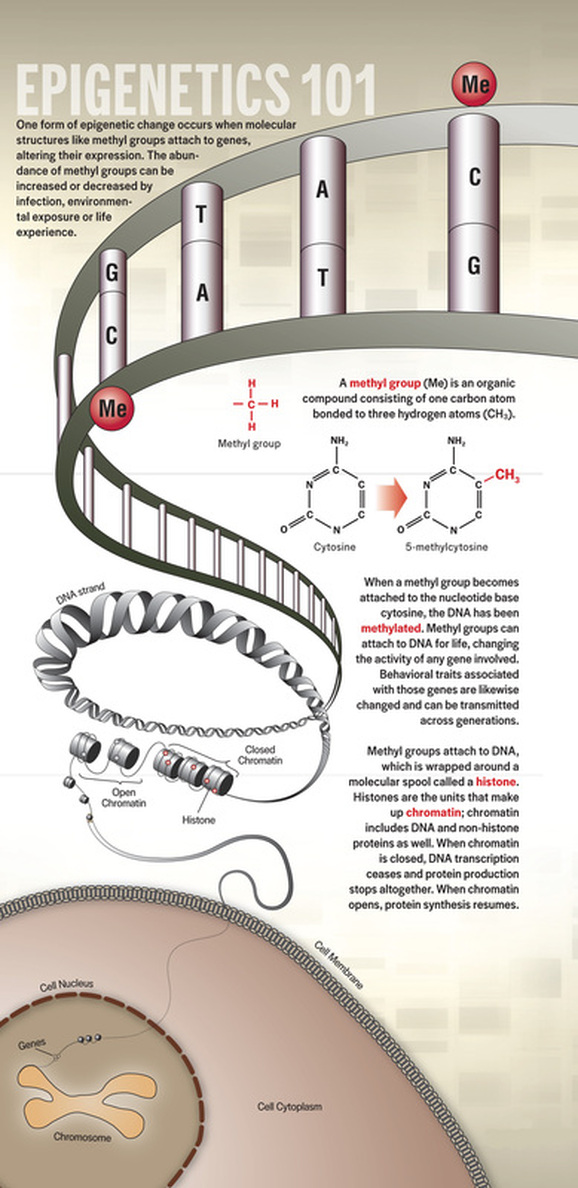
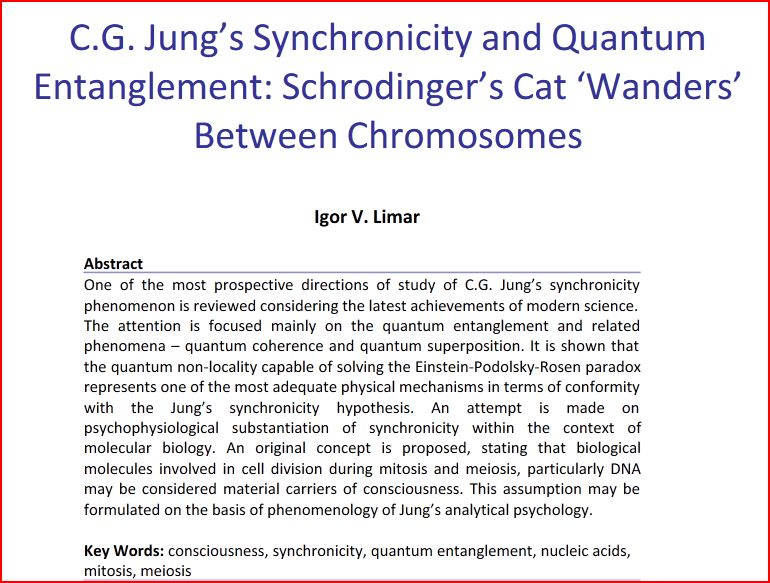

Breaking News: Interactive Genetic History Map Revealed 02/13/2014
An interactive map, produced by researchers from Oxford University and University College London (UCL), details the histories of genetic mixing between each of the 95 populations across Europe, Africa, Asia and South America spanning the last four millennia. The study, published in Science, simultaneously identifies, dates and characterizes genetic mixing between populations. To do this, the researchers developed sophisticated statistical methods to analyze the DNA of 1490 individuals in 95 populations around the world. The work was chiefly funded by the Wellcome Trust and Royal Society.
“DNA really has the power to tell stories and uncover details of humanity's past,” said Dr. Simon Myers of Oxford University's Department of Statistics and Wellcome Trust Centre for Human Genetics, co-senior author of the study.
“Because our approach uses only genetic data, it provides information independent from other sources. Many of our genetic observations match historical events, and we also see evidence of previously unrecorded genetic mixing. For example, the DNA of the Tu people in modern China suggests that in around 1200CE, Europeans similar to modern Greeks mixed with an otherwise Chinese-like population. Plausibly, the source of this European-like DNA might be merchants travelling the nearby Silk Road,” he said.
The powerful technique, christened “Globetrotter,” provides insight into past events such as the genetic legacy of the Mongol Empire. Historical records suggest that the Hazara people of Pakistan are partially descended from Mongol warriors, and this study found clear evidence of Mongol DNA entering the population during the period of the Mongol Empire. Six other populations, from as far west as Turkey, showed similar evidence of genetic mixing with Mongols around the same time.
“What amazes me most is simply how well our technique works,” said Dr. Garrett Hellenthal of the UCL Genetics Institute, lead author of the study. “Although individual mutations carry only weak signals about where a person is from, by adding information across the whole genome we can reconstruct these mixing events. Sometimes individuals sampled from nearby regions can have surprisingly different sources of mixing.
“For example, we identify distinct events happening at different times among groups sampled within Pakistan, with some inheriting DNA from sub-Saharan Africa, perhaps related to the Arab Slave Trade, others from East Asia, and yet another from ancient Europe. Nearly all our populations show mixing events, so they are very common throughout recent history and often involve people migrating over large distances.”
The team used genome data for all 1,490 individuals to identify “chunks” of DNA that were shared between individuals from different populations. Populations sharing more ancestry share more chunks, and individual chunks give clues about the underlying ancestry along chromosomes.
“Each population has a particular genetic ‘palette,’” said Dr. Daniel Falush of the Max Planck Institute for Evolutionary Anthropology in Leipzig, co-senior author of the study. “If you were to paint the genomes of people in modern-day Maya, for example, you would use a mixed palette with colors from Spanish-like, West African and Native American DNA. This mix dates back to around 1670CE, consistent with historical accounts describing Spanish and West African people entering the Americas around that time. Though we can't directly sample DNA from the groups that mixed in the past, we can capture much of the DNA of these original groups as persisting, within a mixed palette of modern-day groups. This is a very exciting development.”
As well as providing fresh insights into historical events, the new research might have implications for how DNA impacts health and disease in different populations.
“Understanding well the genetic similarities and differences between human populations is key for public health,” Myers said. “Some populations are more at risk of certain diseases than others, and drug efficacy is also known to vary significantly. Rare genetic mutations are particularly likely to show strong differences between populations, and understanding their role in our health is an area of intense current research efforts. We hope in future to include even more detailed sequencing, to spot these rare mutations and better understand their global spread. Our method should be even more powerful when applied to these future data sets, providing rich opportunities for future work.”
Source: University College London

Networks of Genes Respond to Social Experiences
October 13, 2013
It is extremely surprising how networks of hundreds of genes respond immediately to human interactions and thoughts—despite the fact that actions of humans are eight orders of magnitude larger than molecular genetic events. But, it is, perhaps, more remarkable that networks of genes respond rapidly to social experiences. Previous posts have discussed the immediate neuroplasticity that occurs in widespread circuits with very complex detailed genetic production of new proteins, including motors, tubules, receptors, and neurotransmitters. The immune system does the same with cytokines, receptors, and antibodies. Now, it has become clear that meditation, tai chi, social interactions, abuse, charitable actions all affect very specific networks of genes in the nervous system and the immune system.
But, how can a network of genes deep inside the nucleus respond to events as if it is a brain? In fact, we don’t know how brains respond in such a detailed genetic manner, but having the genes of individual cells, deep in the nucleus respond as if it is a brain is truly remarkable. When networks of genes respond to social experience, it is further evidence of mind interacting at all levels at once, including the 12 orders of magnitude from world civilizations, to molecules in the nucleus.
Previous posts show how dramatic changes occur in neuronal genes instantly with thought or behavior with neuroplasticity. Recently, it was shown that exercise effects 10,000 genes, that insulin effects 7 thousand genes in the cell. Meditation, a conscious mental activity, causes changes in thousands of genes in immune cells.
Human action or thought alters genes by expressing certain ones and suppressing others. There appears to be a dimmer switch on each gene that can increase or decrease activity based upon many levels of regulation (methylation of DNA, methylation of histones, regulatory molecules such as promoters and inhibitors). The process is even more complex through alternative RNA editing of the code. These alterations of RNA through cells’ self editing of messenger RNA create very particular shaped proteins to express a particular thought, feeling, or activity.
Bees In New Environment Modifies Large Network of Genes Changing environments dramatically alters genes, almost immediately. In a study, infant bees were taken from two very different colonies—one group from the mild mannered European bees and another from the very aggressive African bees. They were then switched and put in the opposite tribe’s hive. Growing up in the new hives, the African bees became calm and the European bees became aggressive.
Remarkably, as the bees changed in their new homes, large networks of genes were completely altered. Being in the new environment completely remapped the networks of genes in a short time. As the bees entirely changed their personality and behavior, they looked more and more like the bees in the new hive. And their genes’ activity looked like them, also.
Every Cell Has All the Genes Every cell has all genes available; so, the difference between stem cells, kidney cells and brain cells is expression of sets of genes in different patterns. Changes in genetic expression occur in specially timed sequences in the fetus, childhood, adolescence and adulthood.
Gene changes, also, occur based on environment, both long term and short term. Most remarkably, they change based upon behavior and thought. Genes switch on to fight different infections, or can become unhinged and develop cancer. If too many genes change, the entire nature of the cell could be different; the entire nature of an organism could be different.
Danger Signals With signals of danger, such as sounds or smells, large numbers of genes become activated at the same time in large networks. The greater the aggression, the greater are the genetic changes. The genes and behavior change together. Hearing a pleasant signal or a danger signal immediately activates and dampens completely different genetic networks. In animal research these gene changes occurred within minutes.
Observing change in gene networks revealed critical specific regulatory genes that are responsible for altering a large group of other genes. These “immediate early genes” were previously known to occur in immunity and in eating. Recently, these same regulatory genes have been found to change entire networks of genes based upon social and behavior experiences.
In one experiment, a dominant fish was removed from a tank and almost immediately the second ranked fish had massive changes in large networks of genes within several hours. In fact, this fish grew 20% in several hours.
Epigenetic Changes Previous posts have described the dramatic findings of ENCODE (Encyclopedia of DNA Elements research consortium of 160 international research centers), which showed that millions of regulatory RNA particles are produced by DNA as well as proteins. These regulatory particles, (including microRNA, long and short non coding RNA, and protein promoters) have dramatic effects on DNA. (See posts on ENCODE and RNA regulatory particles.)
Another type of DNA regulation is epigenetic marking, including methylation of DNA and histones.
Epigenetic markings effect changes that can be inherited for generations. Mothers exposed to famine had altered genes affecting their health. The alterations, also, affected their children and grandchildren. Mothering and caring behavior can change the epigenetic markings and create different genetic network expressions.
Stress related genes alter methylation of DNA, but long-term behavioral changes occur because of neural circuits. How does methylation translate into neural circuits?
Social Experiences Have Powerful Effects on Genes The environment influences the organism as new cells are built each day. Billions of new blood cells, skin cells, and mucosal cells are made each day and these cells’ behavior are triggered by changing DNA networks in response to our experiences, and the chemical environment we are passing through. In the brain many new glial cells and a small number of neurons are, also, made each day.
Social connectivity has powerful effects on genes. The gene networks of social experience are consistent through many animals.
Social isolation is much more devastating than stress—the best-known disease risk factor. Isolated poor people do very poorly, while high pressure stressed people in good networks do well. The diseases of isolation are obesity, diabetes, hypertension, coronary heart disease, and strokes.
Feeling close to others (even if they are not physically present for isolated or imprisoned people) will protect the body with positive gene changes. Experience is what we take from the environment. Perhaps, this is one reason a spiritual teacher provides such support. The fact that subjective perception strongly affects the immune system is evidence of the power of the mind.
Previous posts described the details of dramatic immune changes with both meditation and charitable service. (See post Meditation Update for more details). Both of these are conscious behaviors.
With pleasure from charitable community service (not pleasure from other self oriented activities) there is a decrease in the gene activity of pro-inflammatory cytokines such as IL1B, IL6, IL8, and TNF. There was increased expression of genes involved in type I IFN antiviral responses including IFI-, OAS-, and MX- family genes. There was also increased IgG1 antibody synthesis.
With meditation, yoga, Tai Chi and other practices many positive immune changes occur. These include decreased immune inflammatory factors interleukin 6, and NF-KappaB, and an increase in the important antiviral factor IRF1. Other studies showed decreased inflammation with local skin burns, fewer colds and decreased stress hormones.
Long term meditators and novices both showed epigenetic gene expression changes related to increased mitochondrial resilience. The genes that changed related to very significant functions including energy metabolism, mitochondrial function, insulin secretion, telomere maintenance and decrease in inflammation and oxidative stress responses. The meditators had less respiratory infections. Meditating dementia caregivers had 68 gene changes related to decreased inflammation.
This demonstrates that conscious mental activities and behaviors can have major effects on our immune systems.
Genes and Social Behavior The social world outside determines what the genes do within the nucleus of the cell.
Social experiences can impact genes in many different ways. Genes have regions that if triggered by stress will release cortisol. Another region will stimulate norepinephrine and dopamine to trigger the body’s fight and flight response in cells throughout many organs. These two triggers exist in various places in the genes and can create a variety of different proteins.
The brain responds to social situations by stimulating hormones, immune cytokines and neurotransmitters to produce transcription factors that will alter gene networks. The hypothalamic-pituitary-adrenal (HPA) and sympathetic systems are powerful gene activators. Signaling molecules trigger receptors on the cell surface, then a cascade to the nucleus stimulates the genes. Different transcription factors produce different pathways, such as Nf-kB and CREB.
These different gene networks form a wiring diagram of genetic response. The entire normal brain response to ordinary signals can be altered in this process.
In the isolation experience, for example, the factor NF-kappaB that drives inflammation becomes very important in determining the specific response of signals. Cortisol, which normally inhibits NF-kB, doesn’t do this under stress and isolation. It does the opposite. Therefore, the response to the entire HPA signaling is altered.
The brain is signaling to decrease inflammation, but the receptors and the cascades ignore this. Isolation and social loss both disconnect a critical normal physiological mechanism. This is just one example of complex genetic mechanisms that respond to abuse, isolation, and other social circumstances.
The response to social situations, also, alters RNA editing and transcription, changing the entire network of genetic signals, just as if it were a brain with a new circuit. Chronic stress increases a factor, NGF, and this increases sympathetic nerves in the lymph nodes (the brain circuits of the immune system). As this nerve changes in the lymph node, the response to a virus is decreased. The entire relationship between the immune and nervous system has shifted. Later, interferon genes are inhibited in this process, which changes future responses as well.
In this way an experience creates a new circuit in the immune/nervous genetic systems, which can last for years.
Subjective Mind Changes Genes – Not Just External Situations The place of the mind becomes clearer in this analysis. The psychological perceptions and experiences become the way genetic circuits are modeled—by the perceptions of external events, not the events themselves. It is the subjective mental awareness of these events that determines the genetic rewiring.
Events can alter extensive wiring diagrams through specific genetic pathways. Mind changes how the brain uses its circuits. And mind changes the ways that genetic circuits in cells are altered. In brains measuring MRI doesn’t tell mechanisms or cause and effect. In the same way, measuring genetic circuits doesn’t tell cause and effect.
Networks of Genes Respond to Social Experiences Where is the Brain in the Gene?
It is quite remarkable that brains are able to respond to situations and mental events with almost instantaneous changes in wide ranging circuits, including many different very complex molecular changes in different neurons and astrocytes. A second later, a different circuit of neurons, some including the same neurons and some not, suddenly respond to the next event.
But, it is far more extraordinary to consider that social situations almost instantly trigger networks of genes, deep inside the cell. It appears that there are specific genetic hubs that can suddenly trigger thousands of genes in different ways–stimulating some and inhibiting others. These events trigger far reaching networks of cells, all at once, in the immune system, the hormonal systems, bodily organs and the nervous system. What is the brain deep inside the cell’s nucleus where networks of genes respond to social situations?
It is subjective mind and perception that changes genes, not just external situations. This is further evidence of mind affecting a large number of orders of magnitude simultaneously.
This entry was posted in Blog, Human Brain, Neuronal Plasticity Copyright Jon Lieff 2011. - See more at: http://jonlieffmd.com/blog/networks-of-genes-respond-to-social-experiences#sthash.ZrubKwMy.X1eUL7Y9.dpuf
October 13, 2013
It is extremely surprising how networks of hundreds of genes respond immediately to human interactions and thoughts—despite the fact that actions of humans are eight orders of magnitude larger than molecular genetic events. But, it is, perhaps, more remarkable that networks of genes respond rapidly to social experiences. Previous posts have discussed the immediate neuroplasticity that occurs in widespread circuits with very complex detailed genetic production of new proteins, including motors, tubules, receptors, and neurotransmitters. The immune system does the same with cytokines, receptors, and antibodies. Now, it has become clear that meditation, tai chi, social interactions, abuse, charitable actions all affect very specific networks of genes in the nervous system and the immune system.
But, how can a network of genes deep inside the nucleus respond to events as if it is a brain? In fact, we don’t know how brains respond in such a detailed genetic manner, but having the genes of individual cells, deep in the nucleus respond as if it is a brain is truly remarkable. When networks of genes respond to social experience, it is further evidence of mind interacting at all levels at once, including the 12 orders of magnitude from world civilizations, to molecules in the nucleus.
Previous posts show how dramatic changes occur in neuronal genes instantly with thought or behavior with neuroplasticity. Recently, it was shown that exercise effects 10,000 genes, that insulin effects 7 thousand genes in the cell. Meditation, a conscious mental activity, causes changes in thousands of genes in immune cells.
Human action or thought alters genes by expressing certain ones and suppressing others. There appears to be a dimmer switch on each gene that can increase or decrease activity based upon many levels of regulation (methylation of DNA, methylation of histones, regulatory molecules such as promoters and inhibitors). The process is even more complex through alternative RNA editing of the code. These alterations of RNA through cells’ self editing of messenger RNA create very particular shaped proteins to express a particular thought, feeling, or activity.
Bees In New Environment Modifies Large Network of Genes Changing environments dramatically alters genes, almost immediately. In a study, infant bees were taken from two very different colonies—one group from the mild mannered European bees and another from the very aggressive African bees. They were then switched and put in the opposite tribe’s hive. Growing up in the new hives, the African bees became calm and the European bees became aggressive.
Remarkably, as the bees changed in their new homes, large networks of genes were completely altered. Being in the new environment completely remapped the networks of genes in a short time. As the bees entirely changed their personality and behavior, they looked more and more like the bees in the new hive. And their genes’ activity looked like them, also.
Every Cell Has All the Genes Every cell has all genes available; so, the difference between stem cells, kidney cells and brain cells is expression of sets of genes in different patterns. Changes in genetic expression occur in specially timed sequences in the fetus, childhood, adolescence and adulthood.
Gene changes, also, occur based on environment, both long term and short term. Most remarkably, they change based upon behavior and thought. Genes switch on to fight different infections, or can become unhinged and develop cancer. If too many genes change, the entire nature of the cell could be different; the entire nature of an organism could be different.
Danger Signals With signals of danger, such as sounds or smells, large numbers of genes become activated at the same time in large networks. The greater the aggression, the greater are the genetic changes. The genes and behavior change together. Hearing a pleasant signal or a danger signal immediately activates and dampens completely different genetic networks. In animal research these gene changes occurred within minutes.
Observing change in gene networks revealed critical specific regulatory genes that are responsible for altering a large group of other genes. These “immediate early genes” were previously known to occur in immunity and in eating. Recently, these same regulatory genes have been found to change entire networks of genes based upon social and behavior experiences.
In one experiment, a dominant fish was removed from a tank and almost immediately the second ranked fish had massive changes in large networks of genes within several hours. In fact, this fish grew 20% in several hours.
Epigenetic Changes Previous posts have described the dramatic findings of ENCODE (Encyclopedia of DNA Elements research consortium of 160 international research centers), which showed that millions of regulatory RNA particles are produced by DNA as well as proteins. These regulatory particles, (including microRNA, long and short non coding RNA, and protein promoters) have dramatic effects on DNA. (See posts on ENCODE and RNA regulatory particles.)
Another type of DNA regulation is epigenetic marking, including methylation of DNA and histones.
Epigenetic markings effect changes that can be inherited for generations. Mothers exposed to famine had altered genes affecting their health. The alterations, also, affected their children and grandchildren. Mothering and caring behavior can change the epigenetic markings and create different genetic network expressions.
Stress related genes alter methylation of DNA, but long-term behavioral changes occur because of neural circuits. How does methylation translate into neural circuits?
- Mothering sets up a calibration in the child as to how the brain responds to stress. More methyl groups with less nurturing mothers produce less receptors. Altered hormones affect the baby’s future behavior. Mice raised in groups are better socially and have more receptors. Stress activates more methylation of the gene of BDNF, which produces less BDNF affecting brain cells and neuroplasticity.
- Addiction is another example. It produced more acetylation of histones and decreased methylation of histones in the specific region of reward in the brain, nucleus accumbens, decreasing dendritic spines. More methylation also increased animals desire for cocaine.
- Another example is demonstrated in autopsies of suicide victims. They were abused as children and upon autopsy found to have more methyl groups on the cortisol gene.
Social Experiences Have Powerful Effects on Genes The environment influences the organism as new cells are built each day. Billions of new blood cells, skin cells, and mucosal cells are made each day and these cells’ behavior are triggered by changing DNA networks in response to our experiences, and the chemical environment we are passing through. In the brain many new glial cells and a small number of neurons are, also, made each day.
Social connectivity has powerful effects on genes. The gene networks of social experience are consistent through many animals.
- Studies show human loneliness predicted less immune response to microbes. HIV patients who were hiding their sexual orientation had greater amount of cancers and infections.
- People with more friends have fewer colds.
- Stress has major effects on the immune system. Monkeys with SIV (simian HIV) who were moved constantly into new social groups became ill more frequently. The immune system did not respond to the stress signal.
- Another study showed that lonely and engaged people had dramatic differences in hundreds their genes.
Social isolation is much more devastating than stress—the best-known disease risk factor. Isolated poor people do very poorly, while high pressure stressed people in good networks do well. The diseases of isolation are obesity, diabetes, hypertension, coronary heart disease, and strokes.
- Poor children showed more active inflammatory genes. Ambiguous social situations are threatening and affect immune genes. If the social scene is frightening then it affected gene networks, not just poverty.
- In abused children where negative gene changes occurred, those children who had one adult support experience monthly did not have this gene effect. The lack of connection was more damaging than the abuse. Isolation was the most damaging.
- With ovarian cancer 220 genes were activated for those women with less support and depression.
Feeling close to others (even if they are not physically present for isolated or imprisoned people) will protect the body with positive gene changes. Experience is what we take from the environment. Perhaps, this is one reason a spiritual teacher provides such support. The fact that subjective perception strongly affects the immune system is evidence of the power of the mind.
Previous posts described the details of dramatic immune changes with both meditation and charitable service. (See post Meditation Update for more details). Both of these are conscious behaviors.
With pleasure from charitable community service (not pleasure from other self oriented activities) there is a decrease in the gene activity of pro-inflammatory cytokines such as IL1B, IL6, IL8, and TNF. There was increased expression of genes involved in type I IFN antiviral responses including IFI-, OAS-, and MX- family genes. There was also increased IgG1 antibody synthesis.
With meditation, yoga, Tai Chi and other practices many positive immune changes occur. These include decreased immune inflammatory factors interleukin 6, and NF-KappaB, and an increase in the important antiviral factor IRF1. Other studies showed decreased inflammation with local skin burns, fewer colds and decreased stress hormones.
Long term meditators and novices both showed epigenetic gene expression changes related to increased mitochondrial resilience. The genes that changed related to very significant functions including energy metabolism, mitochondrial function, insulin secretion, telomere maintenance and decrease in inflammation and oxidative stress responses. The meditators had less respiratory infections. Meditating dementia caregivers had 68 gene changes related to decreased inflammation.
This demonstrates that conscious mental activities and behaviors can have major effects on our immune systems.
Genes and Social Behavior The social world outside determines what the genes do within the nucleus of the cell.
Social experiences can impact genes in many different ways. Genes have regions that if triggered by stress will release cortisol. Another region will stimulate norepinephrine and dopamine to trigger the body’s fight and flight response in cells throughout many organs. These two triggers exist in various places in the genes and can create a variety of different proteins.
The brain responds to social situations by stimulating hormones, immune cytokines and neurotransmitters to produce transcription factors that will alter gene networks. The hypothalamic-pituitary-adrenal (HPA) and sympathetic systems are powerful gene activators. Signaling molecules trigger receptors on the cell surface, then a cascade to the nucleus stimulates the genes. Different transcription factors produce different pathways, such as Nf-kB and CREB.
These different gene networks form a wiring diagram of genetic response. The entire normal brain response to ordinary signals can be altered in this process.
In the isolation experience, for example, the factor NF-kappaB that drives inflammation becomes very important in determining the specific response of signals. Cortisol, which normally inhibits NF-kB, doesn’t do this under stress and isolation. It does the opposite. Therefore, the response to the entire HPA signaling is altered.
The brain is signaling to decrease inflammation, but the receptors and the cascades ignore this. Isolation and social loss both disconnect a critical normal physiological mechanism. This is just one example of complex genetic mechanisms that respond to abuse, isolation, and other social circumstances.
The response to social situations, also, alters RNA editing and transcription, changing the entire network of genetic signals, just as if it were a brain with a new circuit. Chronic stress increases a factor, NGF, and this increases sympathetic nerves in the lymph nodes (the brain circuits of the immune system). As this nerve changes in the lymph node, the response to a virus is decreased. The entire relationship between the immune and nervous system has shifted. Later, interferon genes are inhibited in this process, which changes future responses as well.
In this way an experience creates a new circuit in the immune/nervous genetic systems, which can last for years.
Subjective Mind Changes Genes – Not Just External Situations The place of the mind becomes clearer in this analysis. The psychological perceptions and experiences become the way genetic circuits are modeled—by the perceptions of external events, not the events themselves. It is the subjective mental awareness of these events that determines the genetic rewiring.
Events can alter extensive wiring diagrams through specific genetic pathways. Mind changes how the brain uses its circuits. And mind changes the ways that genetic circuits in cells are altered. In brains measuring MRI doesn’t tell mechanisms or cause and effect. In the same way, measuring genetic circuits doesn’t tell cause and effect.
Networks of Genes Respond to Social Experiences Where is the Brain in the Gene?
It is quite remarkable that brains are able to respond to situations and mental events with almost instantaneous changes in wide ranging circuits, including many different very complex molecular changes in different neurons and astrocytes. A second later, a different circuit of neurons, some including the same neurons and some not, suddenly respond to the next event.
But, it is far more extraordinary to consider that social situations almost instantly trigger networks of genes, deep inside the cell. It appears that there are specific genetic hubs that can suddenly trigger thousands of genes in different ways–stimulating some and inhibiting others. These events trigger far reaching networks of cells, all at once, in the immune system, the hormonal systems, bodily organs and the nervous system. What is the brain deep inside the cell’s nucleus where networks of genes respond to social situations?
It is subjective mind and perception that changes genes, not just external situations. This is further evidence of mind affecting a large number of orders of magnitude simultaneously.
This entry was posted in Blog, Human Brain, Neuronal Plasticity Copyright Jon Lieff 2011. - See more at: http://jonlieffmd.com/blog/networks-of-genes-respond-to-social-experiences#sthash.ZrubKwMy.X1eUL7Y9.dpuf
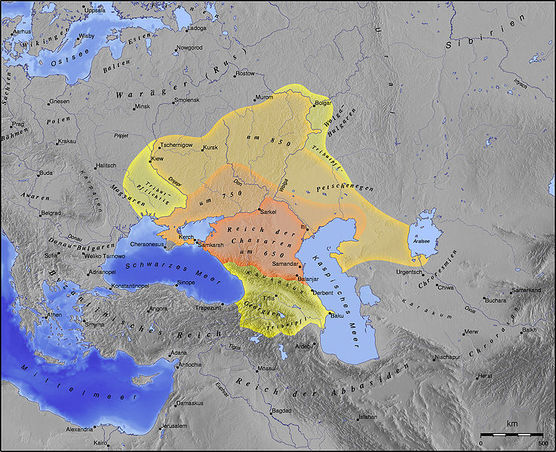
Correcting the Khazar Theory
The “Khazar theory” holds that most Ashkenazim Jews are not Semitic, but are “Central Asian” converts to Judaism. While such conversions likely occured among the Khazaran nobility, the inquisition saw the influx of large groups of Sephardic Jews from Spain and elsewhere toward the Caucasus the Poland-Ukraine, who intermarried with converts.
An April 2008 study titled “Counting the Founders: The Matrilineal Genetic Ancestry of the Jewish Diaspora” (Doron M. Behar et.al., PLoS ONE. 2008; 3(4): e2062. doi: 10.1371/journal.pone.0002062) found that about 40% of Ashkenazi Jews originate maternally from just four female founders, who were of Middle Eastern origin.
December 2009 study titled “Genomic microsatellites identify shared Jewish ancestry intermediate between Middle Eastern and European populations” (Naama M Kopelman et.al., BMC Genetics. 2009; 10: 80. doi: 10.1186/1471-2156-10-80) found that :
“Jewish populations show a high level of genetic similarity to each other, clustering together in several types of analysis of population structure. These results support the view that the Jewish populations largely share a common Middle Eastern ancestry and that over their history they have undergone varying degrees of admixture with non-Jewish populations of European descent.”
A June 2010 study titled “Abraham’s children in the genome era: major Jewish diaspora populations comprise distinct genetic clusters with shared Middle Eastern ancestry” (Atzmon et al., American Journal of Human Genetics, 2010;86:850-859) refuted the idea of large-scale genetic contributions of Central and Eastern European and Slavic populations to the formation of Ashkenazi Jewry.
This study found used genome-wide analysis of seven Jewish groups (Iranian, Iraqi, Syrian, Italian, Turkish, Greek, and Ashkenazi) and “demonstrated distinctive Jewish population clusters, each with shared Middle Eastern ancestry, proximity to contemporary Middle Eastern populations, and variable degrees of European and North African admixture.”
This paper specifically excluded the “Khazar theory” as an origin for present-day Jews, saying “the genetic proximity . . . is incompatible with theories that Ashkenazi Jews are for the most part the direct lineal descendants of converted Khazars or Slavs.”
A March 2012 study by Steven M. Bray et. al., titled “Signatures of founder effects, admixture, and selection in the Ashkenazi Jewish population” (Proceedings of the US National Academy of Sciences, 16222–16227, doi: 10.1073/pnas.1004381107) found that the “Ashkenazi Jewish (AJ) population . . . has a common Middle Eastern origin with other Jewish Diaspora populations” while concluding that the Ashkenazi Jewish population has had the most European admixture.
Ostrer also deals specifically with the Khazar theory. He pointed out that the findings from the Jewish HapMap Project (see below) completely refute “the theories that Ashkenazi Jews are the descendants of converted Khazars or Slavs.” (Jews: A religious group, people or race?, Jerusalem Post, 8/26/2012)
DNA studies amongst Jewish populations around the globe, found no evidence to support a Central Asian DNA origin for Jewry.
According to the Jerusalem Post, the “Jewish HapMap Project in New York City has so far shown “in exquisite detail what had been conjectured for a century. Jewish populations from the major Jewish Diaspora groups – Ashkenazi, Sephardic and Mizrahi – form a distinctive population cluster that is closely related to Semitic and European populations. Within this larger Jewish cluster, each of the Jewish populations formed its own subcluster.
“A high degree of mixing of Ashkenazi, Sephardi, Italian and Syrian Jews caused them to become more closely related to each other than they were to Middle Eastern, Iraqi and Iranian Jews. This genetic split seemed to have occurred about 2,500 years ago.” (Jews: A religious group, people or race?, Jerusalem Post, 8/26/2012)
DNA Studies Find that Ashkenazim Jews have 30% European Admixture
“Jewish communities in Europe and the Middle East share many genes inherited from the ancestral Jewish population that lived in the Middle East some 3,000 years ago, even though each community also carries genes from other sources — usually the country in which it lives,” adding that a “major surprise from both surveys is the genetic closeness of the two Jewish communities of Europe, the Ashkenazim and the Sephardim.”
Wade pointed out that the two studies “refute the suggestion made by the historian Shlomo Sand in his book ‘The Invention of the Jewish People’ that Jews have no common origin but are a miscellany of people in Europe and Central Asia who converted to Judaism at various times.
“Jewish communities from Europe, the Middle East and the Caucasus all have substantial genetic ancestry that traces back to the Levant; Ethiopian Jews and two Judaic communities in India are genetically much closer to their host populations,” Wade wrote.
“The shared genetic elements suggest that members of any Jewish community are related to one another as closely as are fourth or fifth cousins in a large population, which is about 10 times higher than the relationship between two people chosen at random off the streets of New York City.
“Ashkenazic and Sephardic Jews have roughly 30 percent European ancestry, with most of the rest from the Middle East, the two surveys find. The two communities seem very similar to each other genetically, which is unexpected because they have been separated for so long.” (Studies Show Jews’ Genetic Similarity, Nicholas Wade, New York Times, June 9, 2010).
Of the estimated 13 million Jews worldwide, 8 million are Ashkenazim and 5 million are Sephardic, a division of 61% “European Jews” to 39% “non-European Jews.” ...There is actually no “Khazar DNA” in existence, against which any sort of measurement can be taken. As there is no record of what Khazar DNA is—it is, ipso facto, physically impossible to determine who is descended from it and who is not.
“No Evidence from Genome-Wide Data of a Khazar Origin for the Ashkenazi Jews,” this study was published by the journal Human Biology in August 2013 (Behar, Doron M. et.al.; Human Biology, Access Pre-Prints. Paper 41),
“No particular similarity of Ashkenazi Jews with populations from the Caucasus is evident, particularly with the populations that most closely represent the Khazar region. Thus, analysis of Ashkenazi Jews together with a large sample from the region of the Khazar Khaganate corroborates the earlier results that Ashkenazi Jews derive their ancestry primarily from populations of the Middle East and Europe, that they possess considerable shared ancestry with other Jewish populations, and that there is no indication of a significant genetic contribution either from within or from north of the Caucasus region.”
The latest, most up-to-date and modern DNA analysis has, therefore, completely refuted the “Khazar Theory.”
It is important to understand that this refutation has come from non-Jewish and Jewish scientists from dozens of different universities and geneticists all over the world, and cannot be ascribed to a “conspiracy.”
